USEFUL FINANCIAL RATIOS
Post on: 16 Март, 2015 No Comment

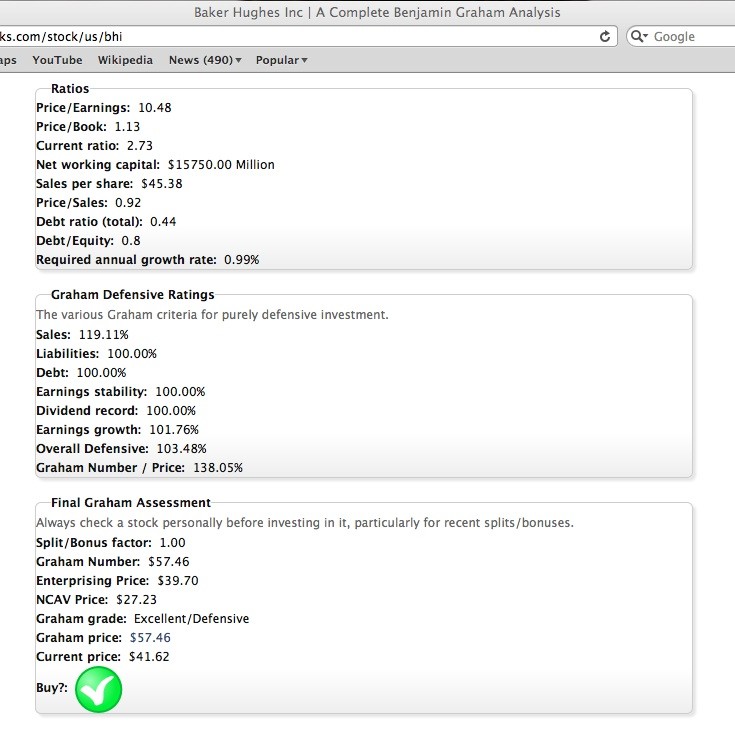
Price to Earnings — or the P/E is the ratio of a company’s share price to its per-share earnings. For example, a P/E ratio of 10 means that the company has $1 of annual, per-share earnings for every $10 in share price. Earnings by definition are after all taxes etc.
P/E ratios help you think about the value of a company, not just the share price. The P/E relates the stock price to the earnings of the company. You want to buy when the present P/E is at or below the average P/E ratio, which is the 5 yr. P/E ratio.
A company’s P/E ratio is computed by dividing the current market price of one share of a company’s stock by that company’s per-share earnings. A company’s per-share earnings are simply the company’s after-tax profit divided by number of outstanding shares. For example, a company that earned $5M last year, with a million shares outstanding, had earnings per share of $5. If that company’s stock currently sells for $50/share, it has a P/E of 10. Stated differently, at this price, investors are willing to pay $10 for every $1 of last year’s earnings.
P/Es are traditionally computed with trailing earnings (earnings from the past 12 months, called a trailing P/E) but are sometimes computed with leading earnings (earnings projected for the upcoming 12-month period, called a leading P/E). Some analysts will exclude one-time
gains or losses from a quarterly earnings report when computing this figure, others will include it. Adding to the confusion is the possibility of a late earnings report from a company; computation of a trailing P/E based on incomplete data is rather tricky. Even worse, some methods use so-called negative earnings (i.e. losses) to compute a negative P/E, while other methods define the P/E of a loss-making company to be zero. The many ways to compute a P/E may lead to wide variation in the reporting of a figure such as the P/E for the S&P whatever. It’s usually next to impossible to discover the method used to generate a particular P/E figure, chart, or report.
Like other indicators, P/E is best viewed over time, looking for a trend. A company with a steadily increasing P/E is being viewed by the investment community as becoming more and more speculative. A company’s P/E ratio changes every day as the stock price fluctuates.
The price/earnings ratio is commonly used as a tool for determining the value the market has placed on a common stock. Companies expected to grow and have higher earnings in the future should have a higher P/E than companies in decline. For example, if ABC company has a lot of products being developed, paying a large multiple of its current earnings to buy the stock might not be a bad idea. It will have a large P/E. I am expecting it to grow quickly. A common rule of thumb is that a company’s P/E ratio should be approximately equal to that company’s growth rate.
PE is a much better comparison of the value of a stock than the price. A $10 stock with a PE of 40 is much more expensive than a $100 stock with a PE of 6. You are paying more for the $10 stock’s future earnings stream. The $10 stock is probably a small company with an exciting
product with few competitors. The $100 stock is probably something fairly level like a zipper manufacturer.
It’s difficult to say whether a particular P/E is high or low, but there are a number of factors you should consider. First, it’s useful to look at the forward and historical earnings growth rate. For example, if a company has been growing at 10% per year over the past five years but
has a P/E ratio of 75, then conventional wisdom would say that the shares are expensive. Second, it’s important to consider the P/E ratio for the industry sector. For example, consumer products companies will probably have very different P/E ratios than internet service providers. Finally, a stock could have a high trailing-year P/E ratio, but if the earnings rise, at the end of the year it will have a low P/E after the new earnings report is released. Thus a stock with a low P/E ratio can accurately be said to be cheap only if the future-earnings P/E is low. If the trailing P/E is low, investors may be running from the stock and driving its price down, which only makes the stock look cheap.
P/E To Growth Ratio (PEG) PEG = Price / projected earnings — you’re looking for less than .75
Dividend Yield = Dividend Per Share / Price Per Share X 100 (percent) Investors who want or need income producing investments use this ratio. There is a trade-off between having a high current dividend yield and having future dividend growth. The dividend pay out ratio (the fraction of current earnings that are paid as dividends) is an indicator of both safety (assurance that the dividend will not be cut in the future) and potential future dividend growth. Maximum suggested pay out ratios seem to vary from 50% for companies with moderate growth, up to 90% for companies such as utilities that have low growth and stable income.
Current Ratio Current Ratio = Current Assets / Current Liabilities Is a basic test of short term liquidity. Generally the higher the ratio, the stronger the financial strength of the company. You are looking for 1.2 :1 or better.
Quick Ratio Current Assets — Inventory / Current Liabilities Company
Current assets that can be readily converted to cash to pay current obligations. You are looking for 1:1 or better. A 1:1 ratio means the company has enough liquid assets to pay its current liabilities.
Leverage ratios measure the extent that a company is relying on debt to fund its operations. Long-term debt may not have to be paid off for many years. However, interest on the debt is a fixed expense that must be paid every year. High interest payments increase the risk that a company may not earn enough to pay the interest if there is an unexpected reduction in sales and profit during a bad year. You are looking for low values. You find the data on the Balance Sheet — current assets, plant, property, equipment, etc. Then look for the components under Total Liabilities such as current liabilities, long term debt, other liabilities.
Long Term Debt To Equity Ratio = Long Term Debt / Equity
Long Term Debt To Capital Ratio= Long Term Debt / Capital
Value Line shows the ratio of Long Term Debt to Capital in the CAPITAL STRUCTURE box.
Total Debt To Equity Ratio = Total Debt / Equity

Total Debt is the sum of Long Term Debt plus Debt Due (a component of Current Liabilities).
Debt to Equity Ratio = Total Liabilities / Shareholder’s Equity Measures how much the creditors/lenders have put into the company versus the shareholders.The lower the %, the greater the company’s financial safety and operating freedom.
Turnover Ratios are indicators of how well company management is using available assets to generate sales and cash. It is desirable for these ratios to have high values.
Receivables Turnover Ratio = Sales / Receivables This is an indicator of how much time elapses before payment is received for a credit sale. In general it is considered desirable for a company to have a high Receivables Turnover Ratio. However, the time it takes to collect receivables varies greatly for different industries.
Inventory Turnover Ratio = cost of sales / 365 days = sales per day average inventory / sales per day = inventory turnover
The number of days it takes to sell the company’s inventory.The shorter the turnover period, the greater the quality and liquidity of inventories. Look for trends.
Value Line Ratios Value-Line Investment Survey
Operating Margin - Earnings before depreciation, depletion, amortization, interest and income tax as a percentage of sales.
Net Profit Margin - Net income before nonrecurring gains and losses as a percentage of sales.
Financial Strength - A relative measure of financial strength of the companies reviewed by Value Line. The relative ratings range from A++ (strongest) down to C (weakest), in nine steps. It is located in the bottom right corner of the Value Line report. You are looking for at least a B+


