Types Of Stock Charts
Post on: 16 Март, 2015 No Comment

Never pulled up a stock chart before? No problem. I’m going to show you four types of stock charts that you can use to display a stock’s price history. A bar chart, candlestick chart, line chart and a lesser known chart type called Heiken Ashi.
A stock’s price history may be displayed on your chart in decades or years all the way down to minutes. Since this website is about day trading, I’ll be showing you charts that have a duration of about one day.
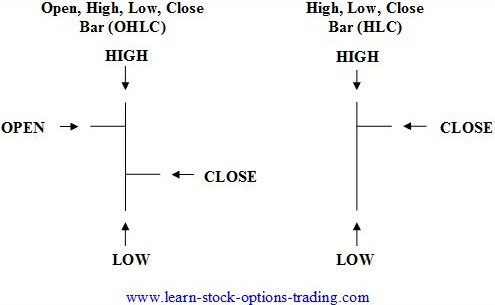
First, lets go over what each individual price bar means. In the image below you can see two types pf price bars.
A OHLC bar and a Candlestick. Traders tend to have a strong preference for either one, but each displays exactly the same data — the Open, High, Low and Closing price of each bar.
They just have a different shape. The bar below is a bullish bar and is black, because its close price is higher than it’s open price.
Depending on what time period you choose for each bar, a single bar may represent a whole day’s worth of trading activity or only 1 minute. In other words, each bar represents the entire trading range, from high to low of the given period.
The next image represents a bearish bar. It’s considered bearish and is colored red, because it’s close price is lower than it’s open price.
BAR CHART
By the way, most charting programs allow you to adjust not only the types of stock charts you display, but the colors of the bars as well. So, if you’d feel more comfortable having a green candle as a bullish bar you could change that easily.
So now that you understand the information that each price bar tells you, lets take a look at some different types of stock charts. The first is the OHLC Bar Chart. Some traders prefer this stock chart type, because they feel it’s slightly better than candlestick charts for drawing trendlines.
All the charts below represent the same time period.
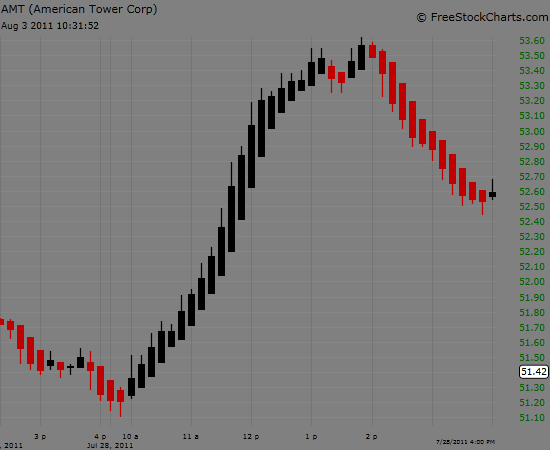
CANDLESTICK CHART
The rectangular portion of a candlestick is called the body. The lines above and below the body are called the shadow or wick. Candlesticks date back to the 17th century, and were used by the Japanese for trading rice.
Although candlestick charts display exactly the same information as simple bar (ohlc) charts, some traders feel adamantly that they can read a stock’s trend better with candlesticks. I’m pretty neutral about this, since I feel comfortable with both.

LINE CHART
Line charts are about as simple as charts get. This type of stock chart is simply made up of only closing prices connected by lines. I don’t know anyone that uses this kind of chart.
You would be at a real disadvantage using line charts since it leaves out three valuable pieces of data (open, high, low).
HEIKEN ASHI CHART
Some consider Heiken Ashi charts to be better than your normal candlestick charts, because of their smoothing effect. I’m not going to go into how the bars constructed, except to say that they are modified candlesticks made from averaged data.
This is what give the appearance of an easier to read trend in prices. Heiken Ashi in Japanese actually means average bar. This special candlestick can create some visually appealing price charts due to it’s trending nature.
But, use caution with this type of stock chart, because due to the formula for the bar, the actual open/close may be different than what you see on your chart.
There’s another stock chart type called Point and Figure. I’m not going to into that one, because frankly I’ve never used it, don’t know anything about it, and it’s probably not the best kind of chart for a beginner like yourself to start out with any way.


