Trading Stocks Education Support and Resistance
Post on: 16 Март, 2015 No Comment

Think of security prices as the result of a head-to-head battle between a bull (the buyer) and a bear (the seller). The bulls push prices higher and the bears push prices lower. The direction prices actually move reveals who is winning the battle.
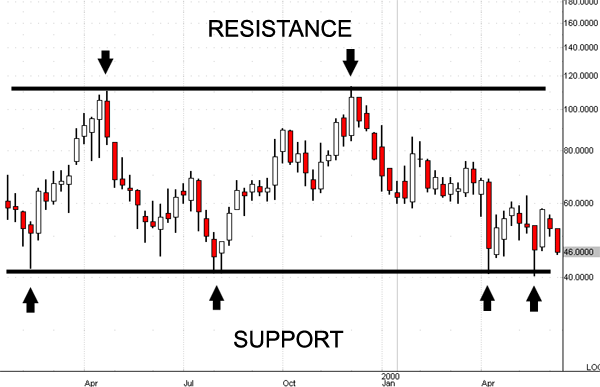
Support is commonly defined as a price level or area at which the demand for a stock will likely overwhelm the existing supply and halt the current decline. Resistance is defined as a price level or area at which the supply for a stock will likely overwhelm the existing demand and halt the current advance.
Notice on the chart above that a form of support is identified: a rising moving average. Several times the COMPX found support and rallied off of the rising 20-period moving average. When this moving average is no longer serving as support, it may be time to open a new playbook. Notice that the break of the 20MA comes after a pullback, so good traders don’t short there necessarily, but the next rally is watched to see how it reacts.
chart courtesy of Mastertrader.com
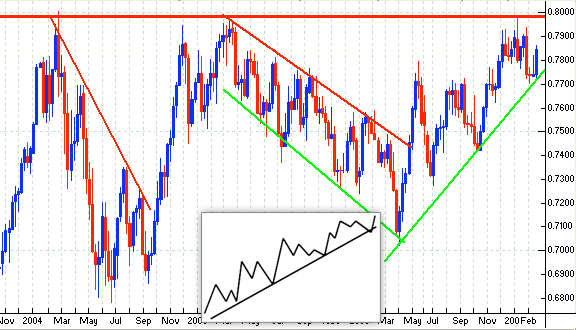
A trendline must be drawn on the chart to represent an area of consistently rising lows. While there is an art to drawing these, for now you can see how this concept works and how the trendline can often be similar to a moving average.
Next we have some examples of major and minor support, forming horizontal support lines.
chart courtesy of Mastertrader.com
Note also that there is what is called as major and minor support. Major support is a pullback to a prior low to re-test that area. Minor support is formed by a pullback to test a prior high.

In the first chart above, notice the base that formed at the end of November. The pullback on Dec. 20 was a test of minor support, the high of that base. Later, on Jan 16, the test was a re-test of that low area so it was major support.
Notice these two areas. First they are areas, not exact numbers. Notice one support area produced a bounce to new highs. The next one bounced one day and failed. That is important to notice.
So what good is this if you can’t nail down support to a single penny, and if sometimes they fail? Isn’t trading supposed to be fool-proof? Well, it is when we get in an area of support that we open up our playbook of bullish strategies and wait for those strategies entries to hit.
Then we take the plays that have good entries and proper stops. This lets the trades that work give good results, and the ones that don’t have small losses. The reverse, of course, applies for resistance and bearish plays. It tells you the time and area that you should look to use the strategies that you have learned to trust.
Stock Stages and Cycles S & R in a Flat Base
Market Mastery Protege Trading Program — Comprehensive Trading Training


