TRADING LESSONS How to Use On Balance Volume (OBV)
Post on: 16 Март, 2015 No Comment

By: Thomas Aspray
Senior Editor, MoneyShow.com
How often have you found a very clear chart pattern, waited patiently and established a position, only to be quickly stopped out as the breakout turned out to be false? Though it has happened to all of us, in many cases, careful analysis of the volume patterns would have kept you out of the trade. If you analyze the trades you have made in the past year, I believe you will find that if you could have avoided just 10% of your trades, the performance would have been greatly improved. Trading strategies that can help you be more selective in the trades you take may be the key to dramatically improving your trading performance.
From previous articles, it should be clear that I find careful analysis of chart patterns essential to any trading strategy. If you do not look at the volume in conjunction with the patterns, you may miss some valuable clues. Any time a market, stock, or commodity makes a new high or a new low, I want to know whether the volume confirmed the new highs or new lows. In other words, to keep a market bullish, you would want to see that new highs are accompanied by equal or higher volume than the previous high. This will tell you that new buyers are likely coming into the market. Conversely, if a market is declining, lower volume on new lows will give the trader an indication that the majority has already sold. Of course, looking at more than one consecutive trading period can give you added confidence.
Figure 1 — Click to Enlarge
The chart above (Figure 1) shows the weekly price activity of the QQQQ, an ETF that mirrors the Nasdaq 100. You will note that as the QQQQ continued to make new lows in July 2002, point 1, the volume continued to expand, hitting a high of 7.34 million shares the week of July 26, 2002. After rebounding for a few weeks, the decline resumed, making a series of new lows in September and finally bottoming in early October, point 2. The volume was about 30% lower on this decline and it shows a pattern of lower highs (line A), suggesting that selling pressure was not as heavy as it was in July.

Figure 2 — Click to Enlarge
When trying to determine whether the overall market is making an intermediate turn, it is beneficial to get confirmation from all sectors. The weekly chart, Figure 2, of the S&P depository receipts (SPY), based on the S&P 500, illustrates that when the July lows were violated in October (line a), volume was less than on the previous low (line b). As the SPY drifted back towards these lows in February and March of 2003, volume was even lower (circle c). Therefore, the selling pressure was also decreasing in the S&P 500, supporting the analysis of the Nasdaq, which suggested the market was bottoming.
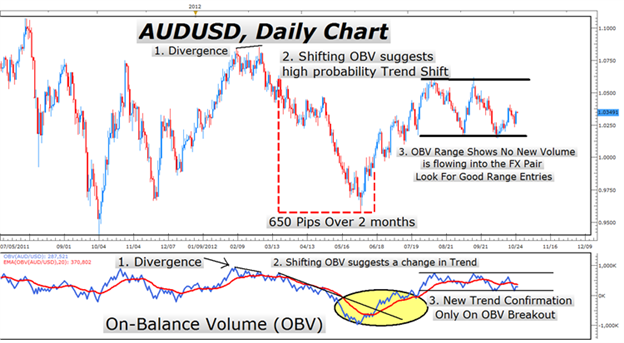
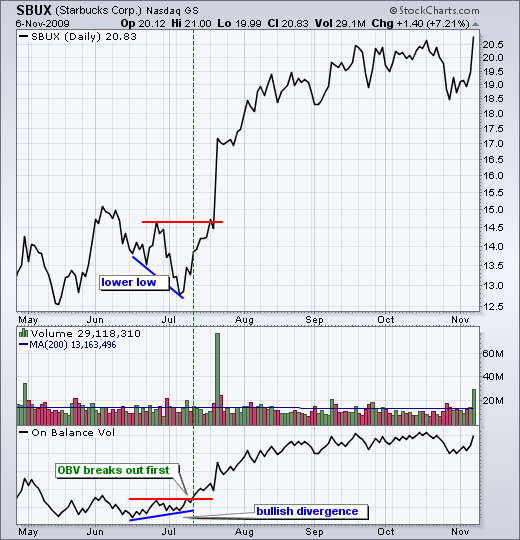
Since the early 1980s, one of my favorite volume indicators has been the On Balance Volume (OBV), developed by Joseph Granville, one of the earliest, and more flamboyant market technicians. He developed it as a way to determine whether the smart money was buying or selling. It is calculated by keeping a running total of the volume figures and then adding in the volume if the close was higher than the previous period, or subtracting the volume if the closing price was lower. If you are doing this in a spreadsheet, such as Excel, the starting volume can be arbitrary, as it is the pattern of the OBV, not the absolute number, that is important. When viewed on a weekly basis, it can be very useful in spotting major turning points. The analysis of the OBV on the major currencies in the spring of 1985 was instrumental in helping me identify the major top in the dollar, despite fundamental opinions and evidence to the contrary.
NEXT: Several Effective Ways to Analyze OBV


