Trading 101 Recommended Reading Japanese Candlestick Charting Techniques
Post on: 16 Март, 2015 No Comment

Learning how to use candlestick charts was probably the second most important thing Ive learned (money management is a clear #1) since I started trading for a living. The funny thing is that when I started trading all of the charts in my trading software were defaulted to displaying candlestick charts. At that time I had no idea of the usefulness of candles and they just seemed strange to me. So I switched all of my charts to line charts. It wasnt until I happened to catch a segment on CNBC with a very successful daytrader that I finally got a clue about candlesticks. That trader had turned $60,000 into more than $500,000 in less than a year. Of course when I heard that I turned around from my usual position of having my back to the TV and paid close attention to what he had to say. At some point during the segment he revealed his secrets hed gone to a 2 week training course and he held up a book that was critical to his success. That book was Japanese Candlestick Charting Techniques by Steve Nison. I immediately went to Amazon and ordered the book.
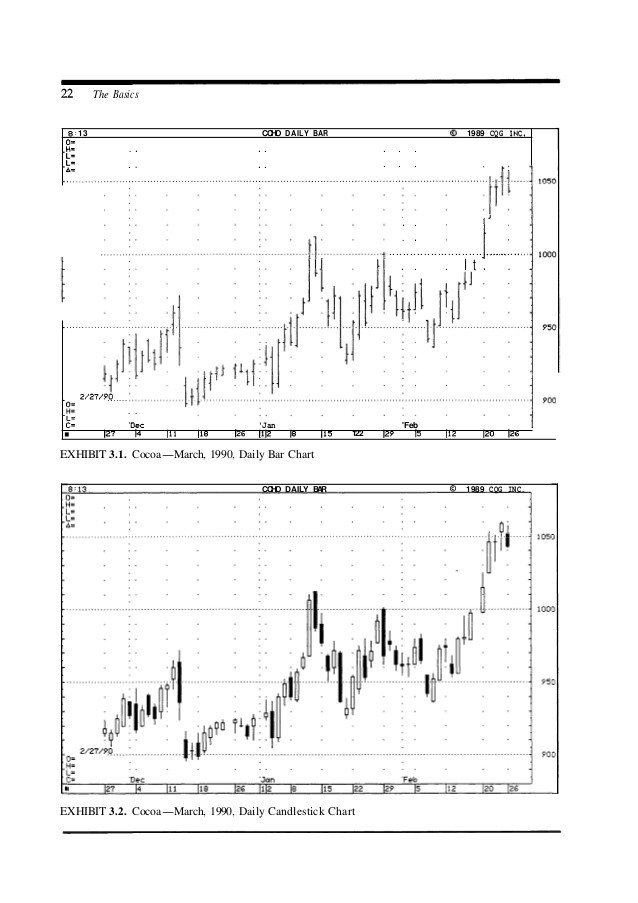
Steve Nison is widely recognized as the foremost expert on candlestick charting in the Western world. He spent years researching candlesticks, mostly via old Japanese documents. In the process he learned a great deal about the history of candlestick charts (and Japanese culture) and he often shares stories of the origination of certain chart patterns. Nison does an excellent job of demystifying candlestick charts. The book begins by comparing bar charts to candlestick charts. The reader quickly learns that candlesticks essentially add a third dimension to 2-dimensional bar charts. Nison takes the reader from the basics of candlesticks, how they are constructed, to their most important uses: reading the emotions of the market and predicting reversals. Its important to realize, as Nison points out repeatedly, that reversal doesnt necessarily mean from up to down, or from down to up. A reversal can also mean from up or down to sideways. In other words a reversal indicator means that the prior trend should end. As part of explaining a candlestick pattern Nison explains how the psychology of market participants made that pattern. His explanations are always accompanied by illustrations. There are many examples of each pattern, and the book is probably close to 50% illustrations.

Nison covers a lot of ground in the book, but it is an extremely easy and quick read. Im confident that after, or probably while, reading this book the reader will become a candlestick chart convert and ever go back to using bar charts. (I was sold by chapter 3.) After reading this book I made some major changes to the way I trade. One of my biggest problems pre-candles was that Id often buy tops or short bottoms. When I converted my charts to candlesticks I went back and looked at many of those losing trades. More often than not there was a candlestick pattern warning me of an impending reversal.


