Technical Analysis Using the Relative Strength Index
Post on: 16 Март, 2015 No Comment

When you’re considering whether to buy or sell a stock, it would be good to consider what other traders are doing in the market. There’s a saying in the market that is often followed: ‘The trend is your friend’. In other words, if the stock is going up (i.e. more buyers than sellers) then it’s right to buy shares, and similarly if the stock is going down, then it’s right to sell shares. But if this were true, then stock prices would never change direction, and trends never reverse.
In the 1970’s, the stock market theorist, J Welles Wilder. developed a theory to identify the turning point of a stock’s share price. His theory looked at the speed of price changes, and the direction of those changes, to come up with a formula that predicts the turning point (or near turning point) of the direction of a stock’s share price.
This wasn’t the only one of Wilder’s theories on stock pricing and direction: he also developed the Directional Movement Concept, the parabolic SAR, and the Average True Range, amongst others. But it is the Relative Strength Index (RSI) that he is perhaps best remembered for.
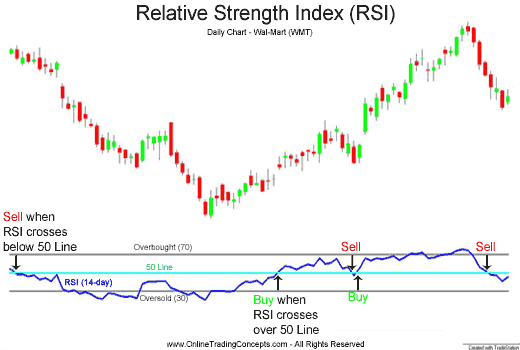
Essentially, the Relative Strength Index (RSI) is a momentum based trend indicator. and you can use it to indicate when a stock is about to reverse trend.
The RSI is based upon a level of 100, a value below 30 indicates an oversold position (a time at which the share price may stop falling and start to rise again). An RSI value of over 70 indicates an overbought position. and a point at which the stock may be about to enter a period of downward price movements.
The RSI calculation is based upon 14 periods, and calculated using the following formula:
RSI = 100- 100/ (1+RS), where the RS (Relative Strength) is the average gain/ average loss over the period.
The average gain is calculated by adding the previous average 13 days gains to the current days gain, and then dividing the result by 14. Any losses during the period are discounted.
The average loss is calculated by adding the previous 13 days losses to the current day’s loss, and then dividing the result by 14. Any gains during the period are discounted, and losses are counted as positive numbers.
One thing to note is that the more data points used to calculate the final values, the more accurate the result (eventually, all gains/ losses will be 14 day averages themselves).
When all fourteen days movements are positive, in other words each one is a gain then there will be an RSI of 100. On the flip side, when all fourteen days’ moves are negative then the RSI will be 0.
If you change the number of days over which the RSI is calculated, then you change the sensitivity of the index. A 10 day RSI is more likely to give an overbought or oversold indicator than a 20 day RSI.
Though an overbought position is considered to be indicated at an RSI value over 70, raising this value to 80 will give fewer overbought indications and increase the accuracy of the RSI.
As with all technical indicators, an overbought or oversold indicator may be followed by higher highs or lower lows, giving the impression of a false negative or false positive. Perhaps it’s wise, when using the RSI, to remember that, for example, though an overbought reading is given at a value of 70, there is plenty of space for the stock to move to an RSI of 100. The reverse, of course, is true of an RSI below 30 and an indication of an oversold position.
As with all technical indicators, other factors need to be taken into consideration. Just as with the MACD, traders using the RSI might wait for the trend reversal to be confirmed .
If you look at the 2 year RSI graph of Microsoft below, you’ll see that on several occasions an RSI of 80 was hit, but the actual high of the stock price didn’t occur for several days. However, when it did the stock moved down for a number of days.
Similarly, when the RSI fell to 20, often the bottom of the stock was not reached for a few days, before the trend was reversed and the share price rose again for a period of time.

(Click to enlarge the image)
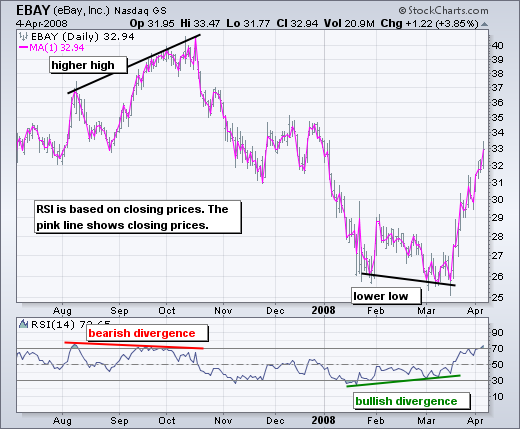
Wilder also said that a divergence of stock price and RSI indicates a turning point in the share price of a stock.
For example, if the share price hits a lower low, but the RSI forms a higher low, then this is a bullish indicator and shows that the share price fall is about to reverse. For example, in the graph above, through the end of June 2011 Microsoft hit a lower low, but the RSI moved higher. This divergence happened just before the share price moved from below $24 to over $28 through the next few weeks.
Similarly, a higher high formed by the share price, but with a lower high formed by the RSI will indicate that the share price trend is about to turn bearish. On the graph above, in early 2011, the stock price was hitting a higher high, while the RSI had reversed direction and started to hit lower highs. Subsequently the share price moved down from $29 to around $25 over the next few weeks.
Of course, in bull markets and bear markets it is only right that the RSI range, when levels of an oversold and overbought position would be indicated, might be different.
In a bull market, when the market is trending higher over the longer period, the range of RSI tends to move higher. Oversold positions are indicated around an RSI of 90, whilst support for shares comes in at around an RSI level of 40 to 50.
In a bear market, an oversold position is generally indicated around an RSI of 10, with resistance to further share price increases coming in at around an RSI level of 50 to 60.
All in all, the RSI is a technical indicator that you can use to augment your stock picking and directional trades. It’s great for the swing trader or position trader. but you might consider giving the trend reversal time to be confirmed before trading. You should also be aware of what type of longer term market you are trading in: RSI targets need to be amended for bull and bear markets .
Now you know more about the RSI, lets move on:


