Tactical Asset Allocation Strategy For More Aggressive Investors
Post on: 25 Июль, 2015 No Comment

This article describes the second in a series of tactical asset allocation (TAA) strategies for long-term investors. I am convinced that a TAA strategy using ETFs (Exchange Traded Funds) is the best option to grow retirement savings with minimum risk over long periods of time. These strategies can be used in 401K or IRA retirement plans that utilize platforms such as Schwab, Fidelity, Scottrade, etc.
I am presenting a number of strategies in this series of TAA articles; some are for more aggressive younger investors, some are for more moderate middle-aged investors, and some are for more conservative retired or near-retired investors. No one wants to live through large drawdowns in retirement savings like what occurred in the 2001-2002 timeframe and in 2008. By moving money between different ETF assets based on relative strength, volatility, and moving day average, it is possible to get the best of both worlds: averaged annual growth of 20% per year with maximum drawdowns of 15% or less. And it is possible to get positive growth every year, even when the equity market does poorly. In a previous article (seekingalpha.com/article/1928941 ) I discussed a moderate TAA strategy that I call the AllAssetsExceptBonds Strategy. That strategy utilized a universe of 15 ETFs. This article will describe a second strategy that I call the CSD-Bond Strategy.
The CSD-Bond Strategy is more aggressive than the AllAssetsExceptBonds Strategy, having higher growth potential and more volatility. The ETF universe of the CSD-Bond Strategy is composed of only three ETFs: 1) Guggenheim Spin-Off ETF (NYSEARCA:CSD ), 2) ishares 20+ Year Treasury Bond ETF (NYSEARCA:TLT ), and 3) ishares 1-3 Year Treasury Bond (NYSEARCA:SHY ). CSD consists of a mid-cap blend of U.S. spin-off companies, and it has shown stellar performance over the past five years (2009-2013) with a CAGR (compounded annual growth rate) of 31.9%. CSD is my representative fast-growing equity ETF. TLT is an ETF consisting of long-term treasuries, while SHY is an ETF consisting of very short-term treasuries. Historically, whenever equities do poorly, money flows into long-term treasuries, and long-term treasuries do very well. This happened when dramatic drops occurred in the equity market in 1987, 2001-2002, 2008, and even a small correction in 2011. As a general rule, long-term bond rates go down (bonds go up) when market conditions are unfavorable for equities.
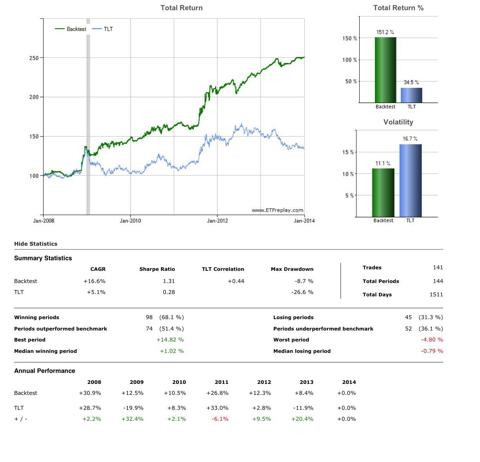
This can easily be seen when long-term treasuries are compared with an equity ETF such as the ishares Core S&P Smallcap 600 Index ETF (NYSEARCA:IJR ) as shown in the figure below. Although there is some variation through the years, a zero-to-negative correlation factor is seen between TLT and IJR in the 2003-2013 timeframe. This TAA strategy (CSD-Bond Strategy) plays on the negative correlation between long-term treasuries and equities by staying in CSD until CSD falls below its five-month moving average, and then moving into TLT or SHY.
However, today’s bond environment might be different than what has been experienced in the past. Since long-term treasury rates are still quite low by historical standards and with continued tapering promised by the Federal Reserve, putting money into long-term treasuries if equities turn south might not be a good move. Thus, this strategy incorporates a fallback position: if CSD drops at the same time TLT is going lower, the money goes into cash (SHY in this case). This strategy compares the relative strength of CSD, TLT and SHY, and selects the best ETF in terms of relative strength. Two relative strength return times are utilized: 3 months and 10 days. One ETF is selected in each bi-monthly period.
The CSD-Bond Strategy was backtested using the ETFreplay software. The results are shown in the figure below. The backtested results only go back to 2008 because CSD was only initiated in December 2006. Thus, the CSD-Bond Strategy’s feasibility is not as well validated as I would like. But with limited backtesting data, the backtested results from 2008-2013 are very good. The CSD-Bond Strategy is in green while the S&P 500 Index (NYSEARCA:SPY ) is in blue. The TAA strategy has a CAGR of 30.9% compared to 6.2% for SPY. $100,000 invested in January 2008 would have grown to $501,700 at the end of 2013. In comparison, the S&P 500 would have only grown to $143,500.
(click to enlarge) The maximum drawdown is 12.9% for the CSD-Bond Strategy, and 51.9% for SPY. Every year produced positive growth for the CSD-Bond Strategy, ranging from 15.7% in 2008 to 44.8% in 2009. Even though CSD had an average volatility of 25.4% over this period, and SPY had an average volatility of 24.4%, the CSD-Bond Strategy had an average volatility of only 17.8%.
The cost of this strategy is minimal. The average number of trades is 12 per year, costing about $216 per year on the Schwab platform.

If there is enough interest in this strategy and my other TAA strategies, I can continually post the bi-monthly selections for investors’ use. Please let me know if you are interested in such a posting.
My next article will feature a more conservative TAA strategy applicable to retired investors, but still having a CAGR of over 17% backtested from 2003-2013. And it has a maximum drawdown of only 9.0% and an overall volatility of 10.1%.
Stay tuned.
Disclosure: I am long CSD. I wrote this article myself, and it expresses my own opinions. I am not receiving compensation for it. I have no business relationship with any company whose stock is mentioned in this article.
Additional disclosure: I am using this strategy with part of my retirement savings.


