Support and Resistance The Trading Range as a Defining Attribute of Price
Post on: 16 Март, 2015 No Comment

Related Essential Technical Indicators articles
Support and Resistance: The Trading Range as a Defining Attribute of Price
Most traders have heard about support and resistance; but few truly understand how significant it is and how it serves as the basis for virtually every technical indicator.
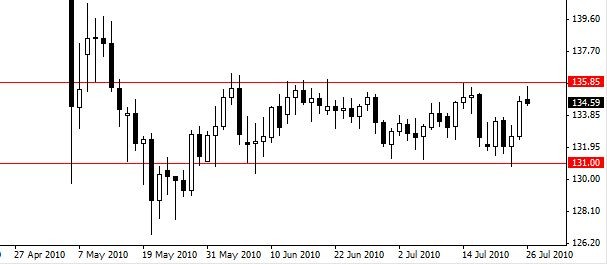
When you go through a list of technical signs and signals, you discover that most of them are given importance based on how they interact with support and resistance. These defining borders of the trading range provide a sense of order and predictability to analysis. When price levels remain within the trading range, it leads to a specific conclusion; when price breaks out above resistance or below support, it leads to a completely different conclusion.
Key Point
Practically all technical indicators are based on a comparison between price action and support and resistance.
A price breakout may retreat to the previously established trading range. If that occurs, it is likely to take place fairly quickly after the breakout. If price continues to move above or below the previous range, it probably means a new trading range is being set.
When price moves out of the current trading range, how do you decide where the new borders should be set? For some traders, the violation of a trading range leads to a period of chaos and uncertainty. Until a new, clearly defined border is set, they cannot rely on price trends. However, an interesting phenomenon occurs in some instances, in which the previous level of resistance becomes the new level of support, or the previous support becomes the new resistance.
This range flip can be used to set a new test for subsequent price movement. If the newly observed resistance or support is later violated in a price reversal, it means the new level of trading will not hold. If the new level is tested but prices remain within its border, it means the newly set range is permanent.
For example, the chart for Altria (MO) in Figure below demonstrates how this flip takes place and how it appears.
Range flip, example 1.
Key Point
The tendency for support and resistance to flip after a successful price breakout is an important clue for traders; this helps add confidence in new trading levels, or to test whether the breakout is going to succeed or fail.
In this example, prices moved above the resistance level and remained there. The previous resistance became support and was tested, seen at the point where two consecutive sessions exhibited long lower shadows but closed above the new support level. This indicates that the new support was strong; because it held at the test, a trader should have confidence in this new support.
Another example is found in the three-month chart of the same period for Wal-Mart (WMT), as shown in Figure below. This is an example of previous support flipping over to new resistance.
Range flip, example 2.
In this situation, the established trading range was newly established but, as the chart reveals, did not last for long. The support level flipped over to become new resistance. This was tested to a degree but it held. In this situation, it appeared that the brief upward movement did not last, and that there was a retreat down to the previous range. The new resistance level (previously the support level) was accompanied by a new support level very close to the original support shown three months earlier.
Support and resistance bring order to what would otherwise look like a completely chaotic price trend. The Wal-Mart three-month chart appears at first glance to be moving all over the map, but when you analyze the exchange between support and resistance, notably with (a) the flip and (b) the reversion to a previous level of support, it becomes clear that there is considerable order in the long-term trend.
The established trading levels define volatility, another name for market risk. The wider the trading range breadth, the greater the volatility; and the more often a breakout occurs (even if prices eventually retreat), the less certainty a trader can have in the price trend. This is especially true if the price history includes many gaps. The bigger the gaps, the more volatile the price and the less predictable the future.
The trading borders are so crucial to most types of technical analysis because price levels take on meaning when these borders are tested. When you review any form of price pattern, you have to be aware of how it interacts with support or resistance, and what it means when price either breaks through or fails to break through. A failed breakout is most often interpreted as the last thing to occur before prices begin a strong move in the opposite direction. In other words, if sellers try to move price down and fail, it is likely that buyers are going to gain momentum and successfully move price higher, and vice versa. This interaction between sellers and buyers is constant and unending, and every trend eventually loses momentum and turns.
Key Point
A rule of opposite movement applies consistently to trading patterns. After a failure to break through one side, prices invariably move in the opposite direction.
These trading range borders also can be defined as the locations where supply and demand are tested and determined, at least within the moment. No current trading range, no matter how firmly held, is going to be permanent. Stock prices are dynamic and will eventually move away from the trading range, either up or down. From the supply and demand side, the forces affecting prices as well as the trading range borders are clearly defined.
When more traders want to buy, prices are driven up due to more demand than supply; when more sellers want to sell, prices are driven down due to more supply than demand. This oversimplifies the process in a sense, because many influences affect prices beyond the simple forces of supply and demand. These forces include momentary perceptions of value, opinions about a company, earnings reports versus analysts estimates, mergers and acquisitions, rumors, lawsuits, product recalls or new product announcements, changes in management, and any other important change or belief about a coming change within a company.
Support is the bottom of the trading range. But more specifically, it is the price level where further decline is unlikely, where buyers consider the price attractive and also where sellers are willing to make trades. Below that level, demand becomes too strong for prices to continue downward because buyers perceive the support level as a good price and anything below that would be a bargain. Demand offsets and even surpasses supply at the support level, which prevents further price decline.
If prices do fall below support, it means that sellers have prevailed. Selling expectations are lower and buyers are not interested, perhaps due to weaker than expected earnings, the perception that the stock is priced too high, or a cyclical negative opinion about the industry that comes from economic change. However, support levels rarely go into a freefall except in a market panic. At some point, the price is going to become cheap enough that buyers will once again want to buy shares. That point sets a new level of support.
Because prices may trade briefly below the established support price, traders acknowledge a support zone in place of a specific price. This is done because prices may dip below support temporarily. On a candlestick chart, you often see a closing price at or above support, but with the sessions trading below that level. This testing of the waters below support may come from an attempted bearish breakout, or simply as a momentary trading glitch that does not last.
Resistance is the opposite of support, or the top of the current trading range. It is the price at which prices are not likely to rise any farther because buyers lack the momentum; put another way, sellers consider the resistance price to be acceptable, but anything above that price would be an inflated value. And so resistance holds for the moment as an agreed-upon price. Buyers are not willing to pay more per share than the resistance price.

Putting this in supply and demand terms, as price levels rise to resistance, sellers are more likely to sell and take profits, and buyers are less likely to buy because the price is relatively high.
Key Point
To best understand how the trading borders defi ne price movement, they have to be interpreted in terms of how buyers and sellers view specific price levels.
A breakout above resistance may be permanent, in which case a new trading range will be set. Prices will not rise indefinitely; at some point, momentum slows down and a new resistance level is established. A breakout may also fail to hold, and prices will retreat to the established trading range. In those instances where prices are especially volatile at or near resistance, traders may set a resistance zone instead of a specific price. This is a small price range where resistance holds, but trading may move above the price briefly.
The nature and volatility of trading within the trading range often define the strength or weakness of the current resistance and support levels. The trading that takes place within the defined range is called the channel. This price movement may remain in a small range or bounce off of both resistance and support while remaining within the borders.
When the channels continue in a sideways pattern for an extended period of time, it indicates that the forces of supply and demand (between buyers and sellers) are evenly matched.
The trading range can be firmly set with fixed price levels, and with trading taking place within that range; or it may be dynamic. In a dynamic trading range, the channel moves either upward or downward and both resistance and support rise or fall. However, the breadth remains approximately the same. So the range is defined by its breadth rather than by a fixed price at the top or at the bottom.
Key Point
The trading range is not always fixed in terms of fixed prices; it can also be represented by a trend upward or downward, but with approximately the same fixed breadth.
An example of a sideways-moving channel was seen in the three-month chart for IBM shown in Figure below.
Channels, sideways movement.
This channel ends in a pattern seen a lot. Prices break the sideways movement by trending upward, but very quickly prices retreat and end up falling below the channel. This type of price movement is uncertain, but one strong clue about the impending downtrend is found in the fifth and sixth sessions after the breakout. The white real body followed by the longer black real body is a bearish engulfing pattern. Although it takes several more sessions for the trend to actually turn, for IBM this signaled that an uptrend was not going to last.
The channel may also trend upward, as in the case of Caterpillar, shown in Figure below. In this chart, the breadth is quite narrow, about four points from top to bottom, but the trend is clearly upward for about two months. The price rose from the mid-50s to the low 70s in this time period without any change in the breadth.
Channels, upward movement.
In a downward-trending channel, the same observation can be made. In the case of the U.S. Oil Fund ETF, which is shown in Figure below, a downward channel moved quickly but the breadth remained at about three points.


