Stock Market Timing Using Historical Moving Averages
Post on: 27 Сентябрь, 2015 No Comment

In the wake of the recent stock market drops, there has been a increased amount of interest in certain market timing systems that would have told an investor to be out of the market during late 2008 and early 2009. Below are a sample of the more popular mechanical systems, which have clear parameters and are easy to follow using basic investing tools.
100-Day Moving Average (FundAdvice.com)
FundAdvice.com is run by Merriman Capital, which provides money management services using both buy-and-hold and market timing models. Ive mentioned them before for their index fund model portfolios and the related Ultimate Buy-and-Hold Portfolio. The website has an entire market timing section, and I am specifically referencing the articles here and here from 2001 and 2002.
Merriman recommends something called the 100-day moving average. For any given asset or mutual fund, you calculate the average of the most recent 100 days of closing prices. Each day, youll have a new average by adding the newest price and dropping the oldest price from the average. Then, you compare the current price of the fund with this simple moving average (SMA).
Each day the market is open, if the current price is above the 100-day SMA, you should buy the fund or hold it if you already own it. If the current price is below the 100-day SMA, sell it. After you sell, place your proceeds in cash (money market fund) until the fund price is once again above the average.
200-Day Moving Average (Faber)
The 2006 paper A Quantitative Approach to Tactical Asset Allocation by Mebane Faber explores a very similar but even simpler mechanical system. Here you take the 200-day simple moving average of any index, for example the S&P 500. But this time, you only calculate this at the end of each month. If the current price is greater than the 200-day SMA, then you buy. If the current price is less than the 200-day SMA, then you sell and move to cash (90-day T-Bills). This results in some impressive backtested results, but with much fewer trades than other systems.
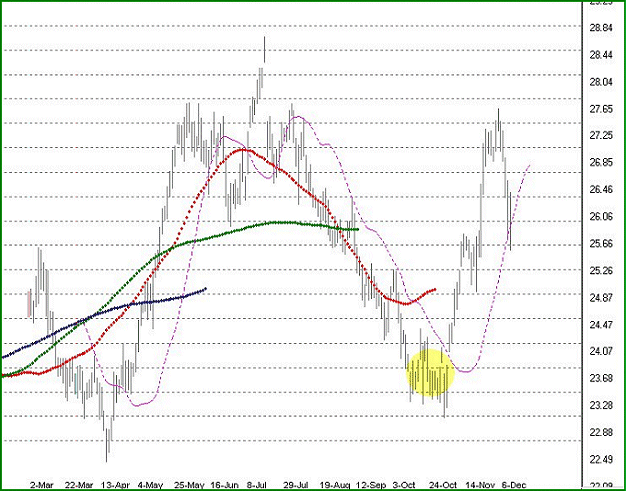
By the way, you can track the 100-day and 200-day SMAs easily using most stock quote websites like Yahoo Finance. Heres the chart for the S&P 500:
As you can see where the S&P 500 is below the green and red lines, you would have been told to sell and stay in cash during some of the big drops.
10-Year Trailing Average P/E Ratio (Shiller)

Prof. Shiller of Yale University is well-known for his book Irrational Exuberance. From Wikipedia: Published at the height of the dot-com boom, it put forth several arguments demonstrating how the stock markets were overvalued at the time. Shiller was soon proven right when the Nasdaq peaked on the very month of the books publication, and the stock markets collapsed right after.
Part of his argument was based on historical price-to-earning ratios, or P/E ratios. This indicator went throw some iterations and became known as PE10, which takes the current price of the S&P 500 and divides it by the average inflation-adjusted earnings for the past 10 years. Essentially, it is a 10-year moving average of the P/E ratio. If the current P/E ratio is significantly higher than the 10-year average, the market is overvalued.
You can find updated numbers and more at his Yale website .
Warnings about Market Timing
Depending on which stock market index you track, and the time period you track, all of the methods above reduce risk (volatility) without significantly reducing overall returns as compared to buy-and-hold. However, there have also been long stretches where timing underperformed buy-and-hold, which can make it a hard strategy to implement over the long run. The main reason we are talking about them now is only due to recent hot performance. In addition, market timing requires regular attention to stock market activity, increased trading costs, and tends to be much less tax-efficient.
Even Merriman states: we have concluded that relatively few investors have the tenacity, discipline and faith required to be successful market timers. But perhaps the same is true for Buy-and-Hold? It is possible that these market timing systems will outperform in the future as well. Or they may not, and youll be jumping in only after a recent hot run. I dont have a well-composed argument either way right now, but I can say that I currently am not using any of the above systems.


