Stochastic Oscillator Indicator Trading
Post on: 16 Март, 2015 No Comment

FORMULA, CALCULATION. DEFINITION & SETTINGS
The Stochastic Oscillator was created by George Lane in the 1950’s, making it older than two other well known indicators, the MACD and the Relative Strength Index.
Like the Williams %R Indicator, the Stochastic Indicator is a momentum indicator that refers to the location of closing bar price relative to the high and low range over a set number of bars.
According to it’s creator, it is designed to follow the velocity or momentum of price. George Lane explained that momentum in general changes, before price changes direction. Therefore, he felt that bullish and bearish divergences in the stochastic indicator could be used to predict reversals. Being that it is range bound oscillator, and can be used to identify overbought and oversold levels, Lane used the Stochastic Oscillator to locate setups for possible reversals.
The calculation is as follows:
%K = 100 * (C — LN) / (HN — LN)
%K — fast stochastic
C — latest close price
HN — highest high for N periods
LN — lowest low for N periods
%D — is an ‘n’ periods simple moving average of %K
George Lane recommended a period of 14 and that is generally what you’ll find as the default period in most technical analysis software. The number can be varied to change the sensitivity for the desired time frame. Generally, traders consider the level above 80 as overbought and below 20 as oversold.
COMMON WAYS TO USE THE STOCHASTIC OSCILLATOR
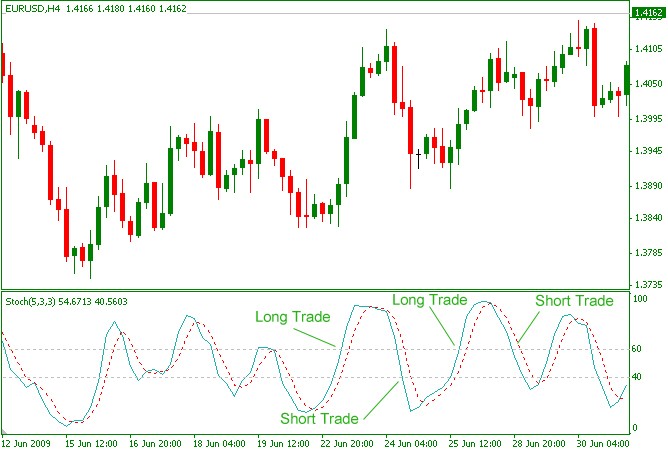
- Buying after the indicator both falls below 20, then rises above 20. Selling/Shorting after the indicator both rises above 80, then falls below 80. Some choose to use the 10 and 90 levels to filter out premature signals.
If you try to use it this way, take my word on this, you’ll encounter many, many whipsaws as a stock begins to trend. Since this oscillator is range bound, as the stock trends upwards, lets say, it will continue to cross above and then below the 80 level, causing you to be whipsawed out of several trades in a row. The method I’ll explain below will help to alleviate some of those false reversal signals.
There are various ways to take advantage of divergences for trading signals, none of which I will cover on this page, since the following strategy uses multiple time frames analysis, rather than a divergence technique. If you would like to learn how to day trade using divergences, I’ll show you some divergence trading techniques in the next stock trading strategy.
STOCHASTIC OSCILLATOR TRADING STRATEGY
But for now, lets concentrate on this day trading method, which uses multiple time frame analysis. This strategy use two time frames — an hourly chart and a 5 min. chart.
Now these particular time frames aren’t set in stone. You might find that you prefer to use a combination of say, a 30 min. and 3 min chart, or a two hour and a 10 min. chart. There is no perfect combination. The general idea is to have one longer time frame chart to determine the trend and the setup, and a shorter time frame chart to signal/trigger your trades.
Just as I said there is no perfect combination of time frames, there is no perfect, or even best stochastic settings for the oscillator. No matter what settings you choose, you’ll find that some days they’ll work marvelously and on others they’ll be terrible.
Although, if you decide to get into backtesting, optimizing indicator variables and all that, you’ll probably find that there is a range of settings for this indicator that make better sense, than others.
That’s a whole different nut to crack.
Since this strategy uses a 5 min. chart for signals, the settings for the stochastic here are a bit faster than the default setting of 14.
COMPONENTS
Hourly Chart with 50 SMA of price
5 min. Chart with Stochastic Oscillator
Stochastic Oscillator (setting: period = 9, %K = 5, %D = 3)
TRADING SIGNALS
The purpose of the hourly chart with a 50 sma is to determine the overall trend of the stock.
In the chart below, I highlighted in yellow, 3 days of hourly bars. Notice how on these three days as well as the previous five days, the 50 sma is rising. This is indicating that for this particular the time frame (hourly chart ) the trend is UP.
So now that you know the trend is currently up on the hourly chart, you take signals off the 5 min. chart. only signals to go long (buy). As long as the 50 sma is rising on the hourly, you can take buy signals on the 5 min. chart using the stochastic. Here’s the rules.
Buy Setup: 50 sma is rising on the hourly chart.
Buy Trigger: %K line crosses above the %D line below 50 (yellow line)
Exit: Discretionary
Short Setup: 50 sma is falling on the hourly chart.
Short Trigger: %K line crosses below the %D line above 50 (yellow line)
Exit: Discretionary
The hourly chart is below.


