SATS the dividend growth stock for the next 10 years
Post on: 13 Май, 2015 No Comment

Some one tells me SATS is a rather good dividend growth stock.
If we invest in it now, how well will dividend grow?
I am not sure. There are many factors that come into play. But its been managed by roughly the same group of folks. That should count for something.
History may be able to tell us how good of a dividend growth stock SATS is.
Lets take a look.
How dividends grow
Dividends grow when free cash flow grow. A lot of folks look at earnings but end of the day free cash flow pays out the dividends not an accounting number.
The cash flow growth of a businesses largely can take the form of three ways
- Organic EBITDA growth. Expand market share. Use resources to move to new market. In the case of SATS this will be to bid for food catering and airport services in other countries. Largely if not, it is due to industry growth. Due to some research on a complementary USA company, seems the industry usually grows at 5% per annum
- Leverage. You sensibly leverage up to take opportunities and then pay down the debt.
- Acquisitions. You become like a private equity firm and acquire earnings. For good management, you may improve on the acquisition to improve ROIC. For bad management, you just destroy the overall ROIC
Some notable acquisitions
The difference between SATS and its sister SIA Engineering (talk about a bit here ) is that SIA engineering tends to form joint venture with key partners to establish a win-win situation.
SATS acquisitions tend to be more in the news
On paper the acquisitions doesn’t look overly expensive and they should be accretive. Management would always sell you that they can improve the efficiency and margins upon acquisitions.
If management is good we should see the EBITDA margins improve and contributing more cash flow throughout the years, especially TFK and SFI .
In time, these should be important cash flow generators for the long term. We should see evidence of that
12 Year Data
Apologies for the 2002 data. I am probably too lazy to correct the formula there.
Revenue Growth
Revenue shows good growth for this 12 years.  From 895 mil it grew to 1.8 bil.
In all it’s a 103% growth or a compounded growth of 6%.
That is rather close to the 5% I mentioned previously.
If no big change for the future 20 years from the past 60 years, we should see a similar revenue growth rate.
EBIT and Free Cash Flow Growth
Since dividends are paid out of earnings and cash flow, as a dividend growth stock, these 2 metrics should be going up 12 years.
EBIT starts off at 216 mil and ended up in 2013 at 200 mil.
Free Cash flow starts off at 166 mil and ended up in 2013 at 234 mil.
Wait, isn’t earnings suppose to grow?
Well at least the free cash flow is growing. Perhaps its showing that it’s a more beautiful lower capital business than anticipated.
The compounded free cash flow growth was 2.9%
On the whole, for most companies, their net income and cash flow should grow much more than their revenue. This doesn’t seem to be the case for SATS.
This is despite accretive acquisitions in 2009 and 2010.
They give me the feeling the acquisition filled a void of higher competition or industry weakness.
Dividends Payout
In total for the 12 years, SATS paid out roughly 1713 mil in dividends.
Compare that to EBIT and FCF of  2280 mil and 2305 mil respectively, it does show that dividends are paid out of cash flow
The interesting thing is the payout ratio starting from 2002:
The payouts have been increasing from the point where there are excess cash to a full payout of earnings.
It would seem the growth here, since there are not much earnings growth is the payout ratio instead .
It looks as if the management are trying damn hard to maintained a 5% yield at prevailing prices.
ROIC and the quality of the company
Much can be told from a little metric called ROIC and COIC.
The job of the manager is to manage capital effectively. If they manage it well, earnings (ROIC) and free cash flow (COIC) well, and leverage and pay of leverage, buy back shares wisely, these 2 metrics should change favorably
- A consistently high ROIC likely indicates either little need of capital (in some industry) or certain moat that prevents competition
- A rising ROIC indicates management creating value
- A falling ROIC either means moat narrowing or management killing it or both
ROIC from 2002 to 2013:
The level of ROIC indicates a very average profile. It is certainly not the kind of 20-30% ROIC you expect from a business with a good moat.
Its interesting that in an economic boom from 2002 to 2009 the ROIC have been falling indicating perhaps tougher competition.
Management at least did well from 2009 to 2013 to correct it.
Perhaps its also due to the timely acquisitions which like SPH served more to prop up cash flow than build on existing strength.
Could share price climb?
The quality of capital deployment as shown by ROIC and COIC have indicated that if the management build on recent capital allocation improvement, the market is likely to reward it with higher share prices.
Indications from ROIC in the first half 2014 seem to indicate that capital management will be within this range.
For share price to climb, ask the question whether management can continue  to do the good work to improve and optimize new acquisitions .
For low ROIC companies, a 1% improvement in ROIC creates greater earnings growth than a 1% improvement in revenue growth .
Terminal 4 and 5 in 12 to 15 years time
A lot of the hype surrounding SATS are the business opportunity to handle Terminal 4 and 5’s airport services. With Terminal 5 as big as Changi, the sky is the limit.
If we use an operating cash flow of 270 mil for 2013, 70 mil perhaps comes from TFK and SFI, we could possibly look at an addition of 260 mil in cash flow 15 years from now.

That in itself may be a 4.7% CAGR.
What could temper with this figure? If they are unable to drive away the competition, this figure could look much lower.
Valuation in the past
Earnings yield at prevailing prices of 1st Jun every year:
For the level of quality if you buy it before 2006 at 8-11% earnings yield. This might be a really good deal with the level of quality you are getting.
Even if it  doesn’t grow, it’s a high enough  compensation versus the competition in assets taking into consideration quality and risk .
At 5.4% it’s a Price Earnings of 18.45 times.
Now Buffett tells us that you would rather pay for a quality business at a fair price than a lousy business at a good price .
If you say SATS is quality, what is a fair price?
We usually consider Price Earnings Growth or PEG of below 1.2 times  to be attractive.
In order for SATS at $3.30 to be considered attractive, at 18 times PE, it should at least grow by 18% per annum for the next 10 years .
If not 10 years you got to wait longer for the growth.
How crazy is 18% growth? consider earnings didn’t even grow for the past 12 years. you tell me.
Your dividend grew due to increase in payout.
Can they turn to acquisitions?
SATS HAVE been turning to acquisitions. And they probably didn’t overpay much.
A 100 mil investment probably will generate 10 mil in cash flow.
10 mil is like a 3.7% growth in EBITDA.
But acquisitions do not come often. You also don’t want SATS to anyhow acquire and over pay.
The moment ROI is below the cost of  capital, its not accretive .
Here is a test of management quality. If they are quality, they should accelerate it.
Acquisitions  usually are the least ROIC enhancing since they are usually a little more than the cost of capital.
Expanding to manage new services
Probably a higher value would be what they have done with Terminal 4 and 5, to find more of these deals  to manage with little capital investments.
What’s the likely future yield
If you have a time machine and you travel 10 years into the future, what will your yield be?
A rough equation would be as follows:
Future yield = Dividend + Share buyback from FCF + Left Over FCF x (ROIC/Cost of Capital) + Organic growth
Dividend and Share buy back gives you 5%.
There isn’t money left over but they can of course leverage. Acquisitions don’t come by often. This probably adds 2% to your yield.
Organic growth depending on whether competition is as brutal could fluctuate between 0% to 7%. Lets take the middle of 3.5%
Your yield probably will be 5 + 2 +3.5 = 10.5%
Lots of assumptions there, but from how my brain worked this out, you probably have an idea how some figures could vary.
Summary
I will leave whether this is a buy or sell to you. I am more in the business of prospecting.
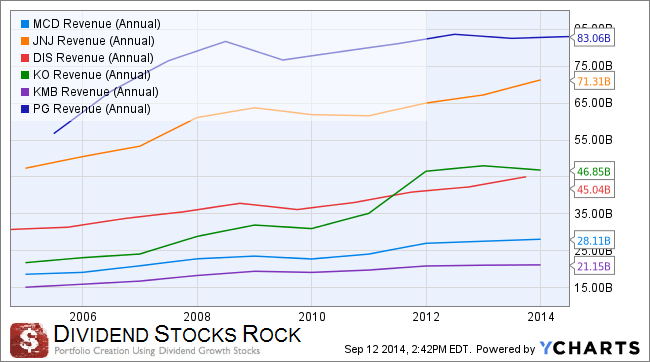
18% growth is more of the kind of growth rate for a top management company like Dairy Farm, Disney and McDonalds.
A rather challenging hurdle considering  they have not even grow in the past 10 years figures wise.
Would Terminal 4 and 5 15 years from now matter so much? Remember that needs capital investments as well.
They do say that good business for a long period tend to remain as such, poor business will also likely remain as such.
We can see a lot from how ROIC performed in the past and as a future indicator if management is doing well there.


