S&P Picks LowestCost Highest Return S&P 500 Index Funds
Post on: 14 Май, 2015 No Comment

DWS Equity, Schwab, T. Rowe Price, Vanguard index mutual funds make the top four
26PFundStars.png /% As a growing number of retail investors put their money into S&P 500 index funds, a Standard & Poors research group has examined 156 such funds and named the four lowest-cost performers in terms of expense ratios and total return.
In making its top picks, S&P considered only retail share classes and excluded funds that are closed to new investors or that require a minimum initial investment of more than $5,000. The four funds each have S&P five-star rankings and three-star Morningstar rankings.
Cost was one of the major contributing factors S&P identified as driving performance disparity among the universe of index funds it reviewed, said Dylan Cathers, an S&P mutual fund analyst who performed some of the S&P 500 index fund research.
The spread between the highest and the lowest of expense ratios was frankly more than I expected it to be, Cathers said. While he acknowledged that there were different ways to invest in the S&P 500 indexfor example, some funds included a mix of cash and derivatives while others were in top-earning holdingspaying well over a 1.0% expense ratio is extremely high, he said.
Its very important for investors to take a step back and see what they are actually being charged and the method they are using to select their funds, Cathers said.
In its research, published as a Trends & Ideas comment in the Standard & Poors MarketScope Advisor on Jan. 31, S&P found a wide disparity in performance among the 156 funds totaling more than $300 billion in assets under management as of Jan. 27. Of the 144 funds in existence for five years, six had a total return of more than 2.4%, while 14 had a return of less than 1.2%.
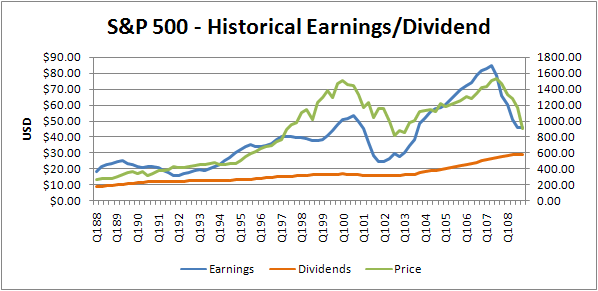
The S&P 500 index saw a five-year annualized return, excluding dividends, of 0.25% between Jan. 27, 2006, and Jan. 27, 2011. The top fund during that period was S&P five-star ranked DFA US Large Company Portfolio (DFUSX) had a total return of 2.49%. In contrast, two-star ranked BB&T Equity Index Fund (BCEQX) had a five-year return of 0.96%. the lowest five-year annualized gain for that period.
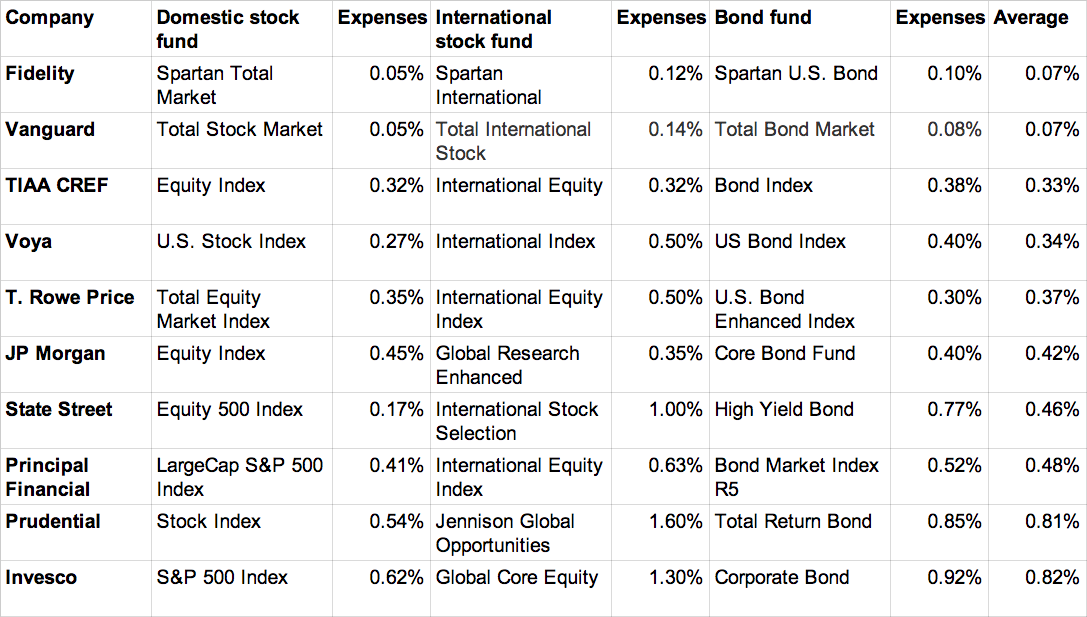
The disparity in expense ratios was just as wide as the difference in returns. The average of the 20 mutual funds with the lowest expense ratios was 0.18%. Conversely, the average of the 20 funds with the highest expense ratios was 1.35%. The lowest expense ratios were populated by institutional funds. After removing institutional funds, there was little difference, with the 20 lowest-expense-ratio funds averaging 0.24%.
Highlights from the S&P report, Why Arent All S&P 500 Index Funds Alike?:
Schwab S&P 500 Index Fund
Over the trailing 10 years through January 27, Schwab S&P 500 Index Fund (SWPPX) outpaced its S&P 500 Index Objective peers on an annualized total return basis, returning 1.43% versus 0.98%. Its outperformance of its peers over the trailing one- and three-year periods helps it earn a positive score for performance analytics. The funds risk considerations score adds to its overall five-star rank, as manager tenure, Sharpe ratio, and standard deviation are all favorable. The funds net expense ratio, at 0.13%, is far below the peer average of 0.64%, it has no sales load, and the portfolio turnover of 3.0% is below the peer averages 11.0%.

Vanguard 500 Index Fund
The Vanguard 500 Index Fund (VFINX) is one of the largest S&P 500 index funds, and is also one of the least expensive. Its net expense ratio is 0.18%, and it has no sales load. Not surprisingly, it is one of the top performers within the S&P 500 Index Objective peer group, posting an annualized return of 2.31% over the trailing five years ended January 27, compared with 1.87% for its peers. As with the other funds in this review, its risk consideration score is positive.
DWS Equity 500 Index Fund
Over the trailing one-, three-, five, and 10-year periods ended January 27, BTIEX has outpaced its peers by an average of about 30 basis points, aiding its performance analytics score. Its risk consideration metrics are solid and generally in line with its S&P 500 Index Objective peers. What helps to set the fund apart is its net expense ratio of 0.21%, which is one third of the groups average. Also, it has no sales load.
T. Rowe Price Equity Index 500 Fund
Another top fund within the group is T. Rowe Price Equity Index 500 Fund (PREIX), which opened in 1990 and has outdistanced its peers by over 450 basis points since inception. Over shorter time intervals, the funds has also beaten the average S&P 500 Index Objective fund, albeit by a slimmer margin. As with DWS Equity 500 Index Fund, PREIXs risk consideration scores are solid and in line with peers. Once again, we find that this strong performing fund has a net expense ratio that is a fraction (half in this case) of the peer average of 0.64%.


