Return on Equity (ROE)
Post on: 13 Май, 2015 No Comment

Investing Lesson 4 — Analyzing an Income Statement
Formula for Return on Equity
Net Profit Average Shareholder Equity for Period = Return on Equity
Return on Equity Example
Take a look at the same financial statements I’ve provided from Martha Stewart Living Omnimedia at the bottom of the page. Now that we have the income statement and balance sheet in front of us, our only job is to plug a the numbers into our equation. The earnings for 2001 were $21,906,000 (because the amounts are in thousands, take the figure shown, in this case $21,906, and multiply by 1,000. Almost all publicly traded companies short-hand their financial statements in thousands or millions to save space). The average shareholder equity for the period is $209,154,000 ([$222,192,000 + 196,116,000] 2]).
Let’s plug the numbers into the formula.
$21,906,000 earnings $209,154,000 average shareholder equity for period = 0.1047 return on equity, or 10.47%
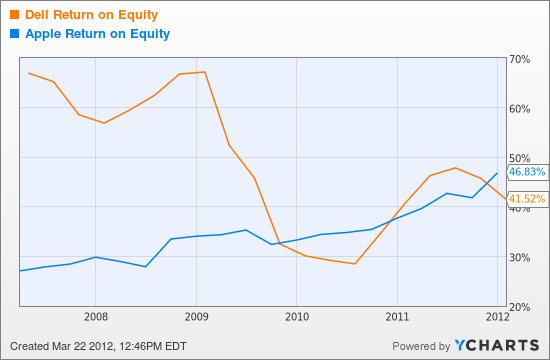
This 10.47% is the return that management is earning on shareholder equity. Is this good? For most of the twentieth century, the S&P 500, a measure of the biggest and best public companies in America, averaged ROE’s of 10% to 15%. In the 1990’s, the average return on equity was in excess of 20%. Obviously, these twenty-plus percent figures probably won’t endure forever. In the past few years alone, small and large corporations alike have issued repeated earnings revisions, warning investors they will not meet analysts’ quarterly and / or annual estimates.
Return on equity is particularly important because it can help you cut through the garbage spieled out by most CEO’s in their annual reports about, achieving record earnings. Warren Buffett pointed out years ago that achieving higher earnings each year is an easy task. Why? Each year, a successful company generates profits. If management did nothing more than retain those earnings and stick them a simple passbook savings account yielding 4% annually, they would be able to report record earnings because of the interest they earned. Were the shareholders better off? Not at all; they would have enjoyed heftier returns had the earnings been paid out as cash dividends. This makes obvious that investors cannot look at rising per-share earnings each year as a sign of success. The return on equity figure takes into account the retained earnings from previous years, and tells investors how effectively their capital is being reinvested. Thus, it serves as a far better gauge of management’s fiscal adeptness than the annual earnings per share.

Variations in the Return on Equity Calculation
The return on equity calculation can be as detailed as you desire. Most financial sites and resources calculate return on common equity by taking the income available to the common stock holders for the most recent twelve months and dividing it by the average shareholder equity for the most recent five quarters. Some analysts will actually annualize the recent quarter by simply taking the current income and multiplying it by four. The theory is that this will equal the annual income of the business. In many cases, this can lead to disastrous and grossly incorrect results. Take a retail store such as Lord & Taylor or American Eagle, for example. In some cases, fifty-percent or more of the store’s income and revenue is generated in the fourth quarter during the traditional Christmas shopping period. An investor should be exceedingly cautious not to annualize the earnings for seasonal businesses.
If you want to really understand the depths of return on equity, you need to open a new browser, leave this lesson in the background, and go read Return on Equity — The DuPont Model. This article will explain the three things that drive ROE and how you can focus on each one to increase your business or determine how safe growth is in another company; you could, for instance, figure out if recent improvements in profits were due to rising debt levels instead of better performance by management.
Excerpts from MSO Financial Statements


