Return Equity Leverage Debt
Post on: 24 Июнь, 2015 No Comment

By Motley Fool Staff | More Articles
Say that your profit margin is ebbing and your asset turnover just ain’t what it used to be. Knowing that you and your fellow managers at Fool’s Jester-Cap Emporium (TICKER: TOPHAT) are going to be compensated based on the return on equity (ROE) that your company is generating, how can you juice it up? Leverage, my boy, leverage. A few hundred million dollars in long-term debt to add some working capital to your balance sheet, and suddenly asset turnover doesn’t appear to be a problem anymore. That capital also lets you expand your operations, pumping out more product at the lower profit margin to increase the raw earnings based on the same shareholder equity. Leverage is the answer — heck, for many, leverage is the American way.
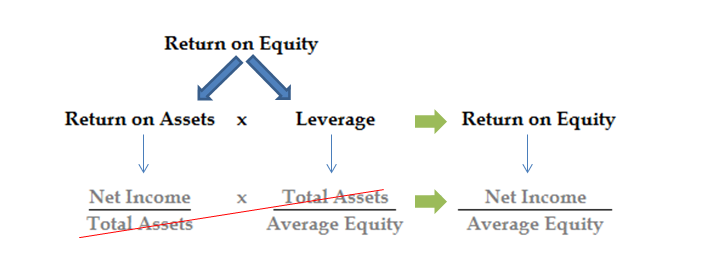
In previous articles, we’ve explored return on equity as a way to analyze a business. Having looked at return on equity as being made up of three parts — profit margin, asset management, and leverage — we’ve examined these parts one by one. Let’s focus on the leg of the ROE tripod known as leverage … a fancy-schmancy word for debt.
A lot of people want you to believe that debt is no good. Most of those people apparently buy their homes with cash. For the rest of the world, debt is much like anything else. It’s OK in moderation, but overdoing it is not a good idea. As anyone who has ever had a high credit card balance can attest, debt tends to feed on itself, growing to enormous proportions with very little food and watering. When a company takes on debt, it increases the total amount of capital it has at its disposal to finance whatever it is it wanted to finance in the first place. Unlike equity, debt carries a direct cost called interest that eats away at a business’s profitability. Sure, if you take on $500 million in debt, you can suddenly produce 1,200 more widgets a day. However, your profit margins on the extra widgets plummet to 5% from 10% because the interest on the debt costs you 5%, meaning that the additional gain becomes incremental.
The problem with adding leverage to a company’s equity as a way to boost ROE is that after a certain point, the actual cost of the debt diminishes profit margins and decreases asset turns. Although there certainly are a number of cases where adding debt makes sense, it is not something that management wants to push as high as possible, unlike profit margins and asset turns. In fact, many perceive earnings generated from debt financing as higher risk than earnings generated from equity financing, particularly if the company is tied to the business cycle in any way, shape, or form. Whereas a company that is completely equity financed can normally ride out a downturn, a company with a large portion of debt financing is unfortunately not quite so well equipped.
Although this flies in the face of Modigliani and Miller’s Nobel-prize winning M&M theorem, which states that the market value of any company is independent of its capital structure, investors often seem to pay less for debt-financed earnings. There are a number of potential explanations for this, the most apparent being that because debt financing increases the risk that the company will be injured in a cyclical downturn, that risk is discounted into the price that investors are willing to pay for future earnings.
Put a bit more clearly, because the debt increases the likelihood of bankruptcy, investors are more cautious about the price they will pay for the stock. This alone should be sufficient to keep managers from maximizing leverage to increase the ROE, as it would have the unintended side effect of minimizing the stock price.
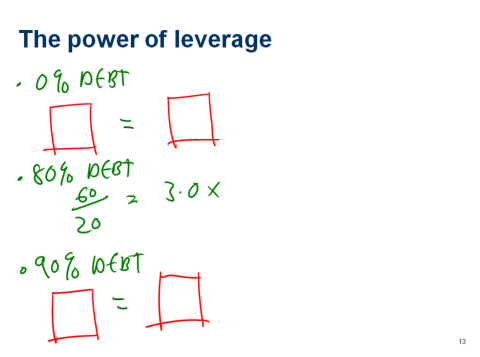
There are almost as many ways to assess how much long-term debt a company has as there are mutual funds, but the five most common include the debt-to-assets ratio, the debt-to-equity ratio, the debt-to-total capital ratio, the debt-to-market capitalization ratio, and the debt-to-revenue ratio. All of these ratios compare the amount of total liabilities to some other relevant part of the income statement or the balance sheet. The parts used for comparison in the five listed ratios are, in order: shareholder’s equity, shareholder’s equity plus long-term debt (total capital), market capitalization, and trailing-12-month revenue. Although most investors at this point thirst for some general rule such as debt should not be more than 20% of shareholder’s equity, the reality is that general rules are just that, very general. There are all kinds of reasons why a company might want to violate a general rule, and little to recommend them, other than the fact that companies that abide by general rules tend to go out of business a little less often.
The best way to analyze debt is to look at the historical trend in debt financing compared to the trend in ROE to see whether a company is maintaining its ROE by juicing up the debt. This is one of the key signs of a business model gone askew, as the company replaces rising profit margins and increased asset efficiency with more and more debt to maintain the same level of shareholder return. An important addition to this is to check whether the company can afford the debt. Comparing the earnings before interest and taxes (EBIT) to the actual interest expense gives you the times interest earned ratio. You take the EBIT instead of just earnings because interest is not taxable, and if you leave in the interest payment, you’re essentially double-counting.

times interest earned = EBIT / interest expense
This ratio tells you how many times a company could have paid the interest on the annual debt burden using its earnings. Again, although there is nothing really to recommend pronouncing some kind of general rule like interest should always be covered 10 times, the higher this number, the better the company can handle its interest burden. Should the number start to drift down, unless the company has ready access to cash on the balance sheet or unused borrowing capacity, the risk part of the pricing equation starts to get larger, driving down the stock price. The basic business the company is involved in also has an effect, as companies where earnings are highly cyclical or volatile would want to have higher interest coverage than the average bear.
If you understand what really goes into the deceptively simple number known as return on equity (ROE), the measure becomes a lens through which to analyze a company. Return on equity is a combination of profit margin, asset management, and financial leverage. By looking at trends in return on equity and analyzing the components, the investor is forced to examine not only the much overlooked statement of operations, or the income statement, but also to balance this against the left and right sides of the balance sheet.
Breaking ROE into these component parts not only allows the investor to determine what kind of return on equity is being generated by a company, but also to examine the quality of that return as well as which financial levers management is pulling to create it. In fact, this way of looking at return on equity creates a system of ratios that allows the individual investor to really understand how the basic business is being managed.
For more lessons on return on equity, follow the links at the bottom of our introductory article .


