Real estate values stock markets and consumer spending 19752012
Post on: 7 Апрель, 2015 No Comment

Omaha suburb (Wikimedia)
The term irrational exuberance was first used back in 1996 it was an oblique attempt by then-Federal Reserve Board chairman Alan Greenspan to head off what would eventually become the dot-com crash. It subsequently entered the popular idiom, and perfectly suited so much of what characterized the run-up to the 2007-2008 financial crisis. Stock market and real estate values rose and so did household spending, a phenomenon known as the wealth effect consumers are, or simply feel, better off, and so spend more. And when the party ended, personal spending crashed along with the stock market and real estate values.
In good times or bad, consumer spending in the United States makes up a huge slice of the countrys economic activity the current figure is 70% so better understanding what influences it is vital to governments, financial institutions and firms. A 2013 study for the National Bureau of Economic Research, “Wealth Effects Revisited, 1975-2012,” examines the relation between household income, consumption, house wealth (measured by change in house prices), and stock market wealth (measured by change in stock prices). The researchers, at Wellesley College, UC Berkeley, and Yale, extend the work they originally did in a 2000 study; the new research includes 7,600 observations in all 50 states and Puerto Rico.
The studys findings include:
- In rising housing markets, a 10% increase in house wealth correlates with a 0.44% to 1.8% increase in consumption. The same increase in stock market wealth is associated with an increase of only 0.28% to 0.75%.
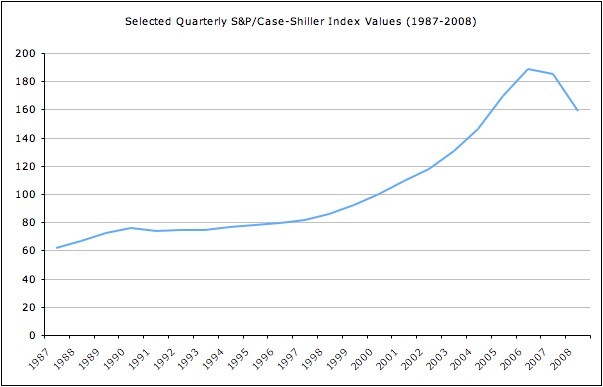
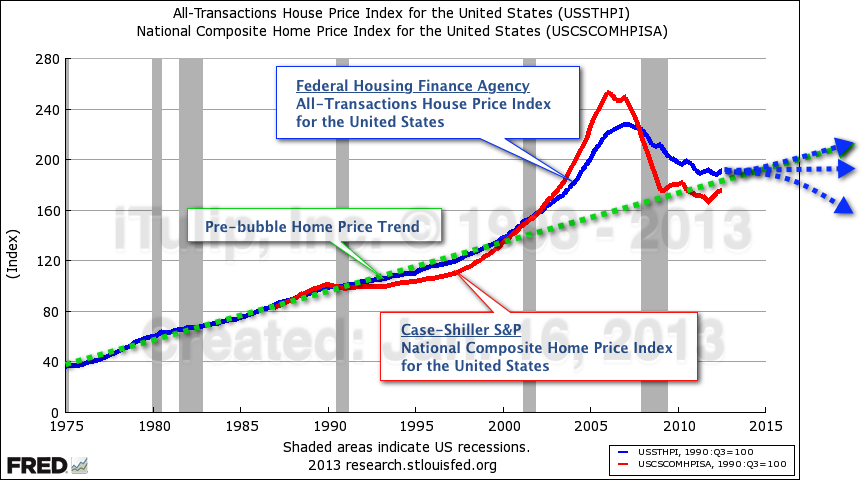
- From 2001 to 2005, the value of U.S. properties owned by individuals increased by $10 trillion; half was due to the appreciation in land value, and the remainder of the rise to the building of new structures. “The most dramatic increases in house values and wealth took place in regional booms, and more broadly at the lower end of the price distribution.” In the housing collapse, at least $6 trillion of those gains evaporated.
- The ability to convert housing stock to free cash and credit through home equity loans, cash-out refinancing and second mortgages led to almost $700 billion of equity being extracted, annually, during the 2001-2005 housing boom.
- The 1986 Tax Reform Act (TRA) significantly changed household spending behavior. In eliminating the deduction for interest payments on credit-card debt, the Act had the effect of encouraging home-equity loans, which could still be deducted. Before the implementation of the TRA, a 10% rise in housing wealth increased consumer spending only 0.4%; after, the same increase resulted in a 1.18% rise in consumption.
- In declining markets, a 1% drop in home prices correlates with a 0.1% decline in consumption. Thus a 35% drop in housing wealth would decrease consumer spending by 3.5%. Consumption is currently about $10 trillion annually, so a 3.5% decrease would translate to $350 billion. To put those figures into context, consider the effects of the decline in housing production from 2.3 million units to 600,000, at $150,000 each. This implies reduced spending on residential capital of about $255 billion. Either has a large impact on the economy; together they have a very large impact.

Overall, the researchers find that the results reinforce our conclusion that changes in housing values continue to exert a larger and more important impact upon household consumption than do changes in stock market values.
Tags: consumer affairs, financial crisis
Writer: Pratibha Joshi | April 5, 2013
Citation: Case, Karl E.; Quigley, John M.; Shiller, Robert J. “Wealth Effects Revisited, 1975-2012,” National Bureau of Economic Research, January 2013.
Analysis assignments
- What key insights from the news article and the study in this lesson should reporters be aware of as they cover these issues?
- What are the study’s key technical terms? Which ones need to be put into language a lay audience can understand?
- Do the study’s authors put the research into context and show how they are advancing the state of knowledge about the subject? If so, what did the previous research indicate?
- What is the study’s research method? If there are statistical results, how did the scholars arrive at them?
- Evaluate the study’s limitations. (For example, are there weaknesses in the study’s data or research design?)
- How could the findings be misreported or misinterpreted by a reporter? In other words, what are the difficulties in conveying the data accurately? Give an example of a faulty headline or story lead.
Newswriting and digital reporting assignments
- Write a lead, headline or nut graph based on the study.
- Spend 60 minutes exploring the issue by accessing sources of information other than the study. Write a lead (or headline or nut graph) based on the study but informed by the new information. Does the new information significantly change what one would write based on the study alone?
- Compose two Twitter messages of 140 characters or fewer accurately conveying the study’s findings to a general audience. Make sure to use appropriate hashtags.
- Choose several key quotations from the study and show how they would be set up and used in a brief blog post.
- Map out the structure for a 60-second video segment about the study. What combination of study findings and visual aids could be used?
- Find pictures and graphics that might run with a story about the study. If appropriate, also find two related videos to embed in an online posting. Be sure to evaluate the credibility and appropriateness of any materials you would aggregate and repurpose.
Class discussion questions
- What is the study’s most important finding?
- Would members of the public intuitively understand the study’s findings? If not, what would be the most effective way to relate them?
- What kinds of knowledgeable sources you would interview to report the study in context?
- How could the study be “localized” and shown to have community implications?
- How might the study be explained through the stories of representative individuals? What kinds of people might a reporter feature to make such a story about the study come alive?
- What sorts of stories might be generated out of secondary information or ideas discussed in the study?


