Ratio Analysis_1
Post on: 16 Март, 2015 No Comment

Financial Ratio Analysis
Financial ratio analysis is a process whereby the analyst or manager determines the degree of financial health represented by the firm’s financial statements. Toward that goal there are a number of ways in which ratio analysis can be useful.
First, it can aid in interpreting and evaluating income statements and balance sheets by reducing the amount of data contained in them to a workable amount. After computing several key ratios whose numerators and denominators are made up of selected items from the statements, a comprehensive analysis of the firm’s financial position can be conducted by evaluating the resulting ratios.
Second, financial ratio analysis can make financial data more meaningful. Any ratio strikes a relationship between the numbers in its numerator and denominator. By selecting sets of numbers that are logically related, only a few ratios may be necessary to comprehensively analyze a set of financial statements.
Third, ratios help to determine relative magnitudes of financial quantities. For example, the magnitude of a firm’s debt has little meaning unless it is compared with the owner’s investment in the business. Thus the debt/equity ratio strikes a relationship between these quantities such that their relative magnitudes can be established.
Because of these advantages, financial ratio analysis can help managers or business analysts make effective decisions about the firm’s credit worthiness, potential earnings, and financial strengths and weaknesses. It involves selecting the financial entities to be compared from either the income statement or the balance sheet, dividing one by the other, and comparing the product with a base. This comparative base could be a history of ratios for the firm (trend analysis), average ratio values from past periods computed from financial statements of other firms in the same industry (industry average comparison), or a combination of the two.
To use the first of these approaches, a ratio’s historical values are computed to determine whether its trend is increasing, decreasing, or constant. The second approach requires availability of industry average financial ratios that were computed in the same way as those of the firm under analysis. There are several published sources of data for such comparisons. The major ones are Dun and Bradstreet’s Key Business Ratios, The Troy Almanac, and Robert Morris Associates’ Annual Statement Studies. Trade associations also publish financial data computed on their member organizations. This data is very useful but unfortunately ordinarily available only to members.
Financial Dimensions
The financial structure of a business has several dimensions. Each financial dimension may be measured by several ratios, but the financial dimensions themselves normally are not directly measurable. To analyze a firm’s financial structure comprehensively, then, one must select a set of ratios made up of subsets, each of which represents a dimension. In this section financial dimensions are explained first. Then the ratios that collectively measure each dimension are discussed. The method of computation for each one is presented, followed by its interpretation.
Liquidity. The liquidity of a firm is its ability to pay current liabilities as they come due (current liabilities are debts due within one year). The only funds available for payment of short-term debt are either cash or other current assets readily convertible to cash. Consequently liquidity is measured by ratios that strike a relationship between current liabilities and selected current assets.
Current ratio = Current assets / Current Liabilities
Current assets are those normally expected to flow into cash in the course of a merchandising cycle. Ordinarily they include cash, notes and accounts receivable (due within the next twelve months), inventory, and marketable securities (at current realizable values).
Current liabilities are short-term obligations for the payment of cash due on demand or within a year. Ordinarily they include short-term notes and accounts payable for merchandise, current portion of long-term debt, taxes due, and other accruals.
Interpretation: This ratio is a rough indication of a firm’s ability to service its current obligations. Generally the higher the current ratio, the greater is the cushion between current obligations and a firm’s ability to pay them. The stronger ratio reflects a numerical superiority of current assets over current liabilities. However, the composition and quality of current assets are a critical factor in the analysis of an individual firm’s liquidity.
Quick ratio = Current assets — inventories / Current liabilities
Interpretation: Also known as the acid test ratio, this is a refinement of the current ratio and is a more conservative measure of liquidity. The ratio expresses the degree to which a company’s current liabilities are covered by the most liquid current assets. Generally any value of less than one to one implies a reciprocal dependency on inventory to liquidate short-term debt.
Coverage. Coverage refers to a firm’s ability to service debt that involves interest or premium payments. Ratios that measure coverage consist of one component to estimate flow of funds into the firm and another for periodic payments on debt.
Times interest earned = Earnings before interest and taxes / Annual interest expense
Interpretation: This ratio is a measure of a firm’s ability to meet interest payments. A high ratio may indicate that a borrower would have little difficulty in meeting the interest obligations of a loan. This ratio also serves as an indicator of a firm’s capacity to take on additional debt.
Profitability. This familiar dimension of a company’s financial structure concerns management’s ability to control expenses and to earn a return on committed funds. Ratios that measure profitability usually consist of a profit element and one that represents the amount of funds invested in whatever aspect of the firm is of interest to the analyst.
Net profit can be calculated either before or after taxes. Robert Morris Associates and the following explanation use net profit before taxes. The analyst should ensure that the ratio elements used to compute the profitability ratios (and others as well) are the same as those used to compute the industry average against which the ratio’s value will be compared. Also note that the following two ratios are converted to and reported as percentages.
Return on Sales (ROS) = EBIT / Sales (percent)
Return on Equity (ROE) = EBIT / Shareholder’s Equity
Interpretation: This ratio expresses the rate of return on tangible capital employed (called net worth or capital or owners’ equity less intangibles). While it can serve as an indicator of management performance, the analyst is cautioned to use it in conjunction with other ratios. A high return, normally associated with effective management, could indicate an undercapitalized firm. A low return, usually an indicator of inefficient management performance, could reflect a highly capitalized, conservatively operated business.
Return on Assets (ROA) = EBIT / Total assets
Interpretation: This ratio expresses the return on total assets and measures the effectiveness of management in employing the resources available to it. If a specific ratio varies considerably from the ranges found in published sources, the analyst will need to examine the makeup of the assets and take a closer look at the earnings figure. A heavily depreciated plant and a large amount of intangible assets or unusual income or expense items will cause distortions of this ratio.
Leverage. The extent to which the firm relies on debt as opposed to owner’s capital (net worth) is its leverage position. A highly leveraged firm is one with a high proportion of debt relative to owner’s investment.
Debt to equity Ratio = Total debt / Tangible stockholder’s equity
Interpretation: This ratio expresses the relationship between capital contributed by creditors and that contributed by owners. It expresses the degree of protection provided by the owners for the creditors. A lower ratio generally indicates greater long-term financial safety. A firm with a low debt/worth ratio usually has greater flexibility to borrow in the future. A more highly leveraged company has more limited debt capacity. Generally the order or preference given to this ratio is arranged on a continuum such that a low negative ratio is characterized as a weak debt/worth position and a high positive ratio value is perceived as a strong debt/worth position.
Long-term debt to equity = Long-tern debt / Total Stockholder’s Equity

Interpretation: This ratio measures the extent to which owner’s equity (net worth) has been invested in plant and equipment (fixed assets). A lower ratio indicates a proportionately smaller investment in fixed assets in relation to net worth, and a better cushion for creditors in case of liquidation. Similarly, a higher ratio would indicate the opposite situation. The presence of substantial leased fixed assets (not shown on the balance sheet) may lower this ratio deceptively. The order of preference normally given this ratio is the same as debt/worth.
Activity. Activity ratios, also called efficiency or turnover ratios, measure how effectively a firm’s assets are managed. Examining the relationship between a measure of sales and an asset account is their purpose.
Inventory turnover = Sales / Inventory
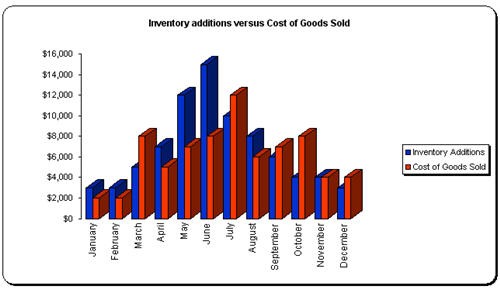
Interpretation: This ratio measures the number of times inventory is turned over during the year. High inventory turnover can indicate better liquidity or superior marketing. Conversely it can indicate a shortage of needed inventory for sales. Low inventory turnover can indicate poor liquidity, possible overstocking, obsolescence, or, in contrast to these negative interpretations, a planned inventory buildup in preparation for future material shortages. A problem with this ratio is that it compares one day’s inventory (at the end of the accounting period) with cost of goods sold and does not take seasonal fluctuations into account. One way to resolve this problem when sufficient data are available is to calculate cost of sales and average inventory by month to develop turnover ratios for each month. Further, it may prove extremely useful to break up cost of sales and inventory by different classes of products.
Fixed asset turnover = Sales / fixed assets
Interpretation: This ratio is a measure of the productive use of a firm’s fixed assets. Largely depreciated fixed assets of a labor-intensive operation may cause a distortion of this ratio.
Total asset turnover = Sales / Total assets
Interpretation: This ratio is a general measure of a firm’s ability to generate sales in relation to total assets. It should be used only to compare firms within specific industry groups and in conjunction with other operating ratios to determine the effective employment of assets.
What does the ratio analysis mean? You should ask questions about what you find, for example:
based on Comerford, R. A. and D. W. Callaghan, Strategic Management: Text and Tools for Business Policy


