Profitability Ratio Analysis
Post on: 16 Март, 2015 No Comment

Determining Profitability is Important to Company Investors
You can opt-out at any time.
Every firm is most concerned with its profitability. One of the most frequently used tools of financial ratio analysis is profitability ratios which are used to determine the company’s bottom line and its return to its investors. Profitability measures are important to company managers and owners alike. If a small business has outside investors who have put their own money into the company, the primary owner certainly has to show profitability to those equity investors.
Profitability ratios show a company’s overall efficiency and performance. We can divide profitability ratios into two types: margins and returns. Ratios that show margins represent the firm’s ability to translate sales dollars into profits at various stages of measurement. Ratios that show returns represent the firm’s ability to measure the overall efficiency of the firm in generating returns for its shareholders.
Margin Ratios
Gross Profit Margin
Operating Profit Margin
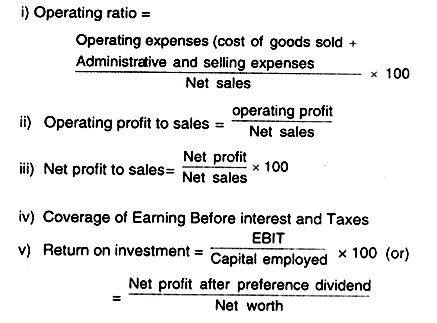
Operating profit is also known as EBIT and is found on the company’s income statement. EBIT is earnings before interest and taxes. The operating profit margin looks at EBIT as a percentage of sales. The operating profit margin ratio is a measure of overall operating efficiency, incorporating all of the expenses of ordinary, daily business activity. The calculation is: EBIT/Net Sales = _____%. Both terms of the equation come from the company’s income statement .
Net Profit Margin
When doing a simple profitability ratio analysis, net profit margin is the most often margin ratio used. The net profit margin shows how much of each sales dollar shows up as net income after all expenses are paid. For example, if the net profit margin is 5%, that means that 5 cents of every dollar is profit.
The net profit margin measures profitability after consideration of all expenses including taxes. interest, and depreciation. The calculation is: Net Income/Net Sales = _____%. Both terms of the equation come from the income statement.
Cash Flow Margin
The Cash Flow Margin ratio is an important ratio as it expresses the relationship between cash generated from operations and sales. The company needs cash to pay dividends. suppliers, service debt. and invest in new capital assets, so cash is just as important as profit to a business firm.
The Cash Flow Margin ratio measures the ability of a firm to translate sales into cash. The calculation is: Cash flow from operating cash flows/Net sales = _____%. The numerator of the equation comes from the firm’s Statement of Cash Flows. The denominator comes from the Income Statement. The larger the percentage, the better.
Returns Ratios
Return on Assets (also called Return on Investment)
The Return on Assets ratio is an important profitability ratio because it measures the efficiency with which the company is managing its investment in assets and using them to generate profit. It measures the amount of profit earned relative to the firm’s level of investment in total assets. The return on assets ratio is related to the asset management category of financial ratios .
The calculation for the return on assets ratio is: Net Income/Total Assets = _____%. Net Income is taken from the income statement and total assets is taken from the balance sheet. The higher the percentage, the better, because that means the company is doing a good job using its assets to generate sales.

Return on Equity
The Return on Equity ratio is perhaps the most important of all the financial ratios to investors in the company. It measures the return on the money the investors have put into the company. This is the ratio potential investors look at when deciding whether or not to invest in the company. The calculation is: Net Income/Stockholder’s Equity = _____%. Net income comes from the income statement and stockholder’s equity comes from the balance sheet. In general, the higher the percentage, the better, with some exceptions, as it shows that the company is doing a good job using the investors’ money.
Cash Return on Assets
The cash return on assets ratio is generally used only in more advanced profitability ratio analysis. It is used as a comparison to return on assets since it is a cash comparison to this ratio as return on assets is stated on an accrual basis. Cash is required for future investments. The calculation is: Cash flow from operating activities/Total Assets = _____%. The numerator is taken from the Statement of Cash Flows and the denominator from the balance sheet. The higher the percentage, the better.
Comparative Data
Financial ratio analysis is only a good method of financial analysis if there is comparative data available. The ratios should be compared to both historical data for the company and industry data.
Tying it all Together — The DuPont Model
There are so many financial ratios — liquidity ratios. debt or financial leverage ratios. efficiency or asset management ratios. and profitability ratios — that it is often hard to see the big picture. You can get bogged down in the detail. One method that business owners can use to summarize all of the ratios is to use the Dupont Model.
The Dupont Model is able to show a business owner where the component parts of the Return of Assets (or Return on Investment ratio comes from as well as the Return on Equity ratio. For example, did ROA come from net profit or asset turnover. Did return on equity come from net profit, asset turnover, or the business’ debt position? The DuPont model is very helpful to business owners in determining in financial adjustments need to be made.


