PEG Ratio Definition Explained Calculating Growth Stock Valuation
Post on: 23 Июль, 2015 No Comment

Stocks go up in price for a number of reasons: a favorable news report, an entire sector rising, the appearance of undervaluation based on historical fundamental data, or trading by technical analysts based on bullish price and volume patterns.
For a stock to sustain a steep price increase, it should be expected to experience high revenue and earnings growth. But is expected growth alone enough to decide if a company represents a good valuation? Of course not. One also needs to look at the stock price to determine if it represents a strong valuation relative to the companys expected growth.
In this post, I will explain the shortcomings of only analyzing a companys growth potential or P/E ratio, and then move onto the ratio that combines these two forms of analysis into a quality metric: the PEG ratio (Price to Earnings Dividend by Growth).
High-Growth Stock Investing and Earnings Forecasts
Once a stock achieves a market capitalization of at least $500 million, financial analysts will usually provide coverage. This coverage will typically include a rating and an earnings estimate. The rating can be as simple as follows: strong buy, moderate buy, neutral, moderate sell, and strong sell. An earnings forecast involves estimating the net profit per share.
In addition to providing guidance for the upcoming fiscal quarter and year, the analyst will usually give longer-range forecasts that calculate an average annual gain over a 5 year horizon for the companys earnings. You can pick high-growth stocks by simply looking for companies that have abnormally high anticipated annual earnings growth rates over the next 5 years. This forecasted earnings figure is the input to be used in the PEG ratio.
Are there other ways to scan for high growth stocks besides future analyst estimates? Yes, and some are particularly welcome when a company is small and does not have forward-looking projections.
Analyze Historical Earnings Growth
One method is to analyze historical earnings growth for previous years and quarters. For example, if a company has been able to grow bottom-line profits at 20% annually for the past few years, it may well be that this pattern will continue. You can also scan for high-growth industries. Do you expect green energy to boom in the near future? What about oil or silver prices. Based on your analysis, you can look for small companies with high exposure to those commodities or industry trends.
In general, although not always true, smaller companies have an easier time achieving high growth. This is true since doubling revenue or earnings from $100 to $200 is much simpler than turning $100 million into $200 million. But large companies can enjoy high growth too, as companies like Apple have proven.
Getting back to the 5 year expected growth estimates, here are a few companies and their analyst estimates, which is the basis for the PEG ratio:
- International Coal Group (NYSE: ICO) is expected to grow its earnings 77% annually over the next 5 years.
- Comtech Telecommunications Corp. (NASDAQ: CMTL) is expected to increase annual earnings by 35% annually over the next 5 years.
- SIRIUS XM Radio (NASDAQ: SIRI) is expected to grow 30% annually over the next 5 years.
Based on this data alone, one might conclude that ICO is the best high-growth stock to own, with CMTL coming in second, and SIRI a close third. But are we forgetting something? While we know the estimated growth rate of earnings, how can we determine if the share price is a fair value? Is this a good time to buy the high-growth stock?
Relative Value Using Price to Earnings Ratio
How do you know if your stock is high-priced or low-priced compared to the amount of profit? You can run a simple formula to find out. It is called the price to earnings ratio. or the P/E ratio.
By simply dividing the current share price by the earnings per share, you can discover how many times higher the price is than the annual profits. First, lets calculate the PE ratio for the above 3 stocks and then we will discuss the relevance.
- ICO has a price of $10.85 per share. It has earned 15 cents per share. $10.85 / 0.15 = price to earnings ratio of 72.3. The share price is trading 72.3 times higher than its earnings.
- CMTL has a price of $26.72 per share. It has earned $2.42 per share. $26.72 / $2.42 = price to earnings ratio of 11.04. The share price is trading 11.04 times higher than its earnings.
- SIRI has a price of $1.66 per share. It has earned 1 cent per share. $1.66 / 0.01 = price to earnings ratio of 166. The share price is trading 166 times higher than its earnings.
What does this price to earnings ratio tell us? We could compare the P/E ratio to other similar stocks to see if the ratio is relatively high or low in relation to its peers. But stocks with higher growth generally trade at higher multiples than value stocks with lower future growth opportunities, since a stocks price is based in large part on future value and not on current cash and assets on hand.

Thus, the P/E ratio alone does not tell us all we need to know. To gauge whether a stocks P/E ratio is warranted or represents a valuable investing opportunity, we need to compare it to the companys future growth prospects.
So how do we go about this comparison? This is where the PEG ratio comes in.
Introduction to the PEG Ratio
What does the PEG ratio stand for and how will it help us value stocks? The PEG ratio is simply this: the price to earnings ratio (P/E ratio) divided by estimated future earnings growth. The future growth generally uses the 5-year average figure (but you can also use the 3-year figure, your own forecast, or the earnings guidance provided by the company). Using this ratio we can estimate:
- ICO has a PE of 72.3 and expected growth of 77% per year. The PEG ratio is 0.94.
- CMTL has a PE of 11.04 and future growth expectations of 35% annually. The PEG ratio is 0.32.
- SIRI has a PE of 166 and future growth expectations of 30% annually. The PEG ratio is 5.53.
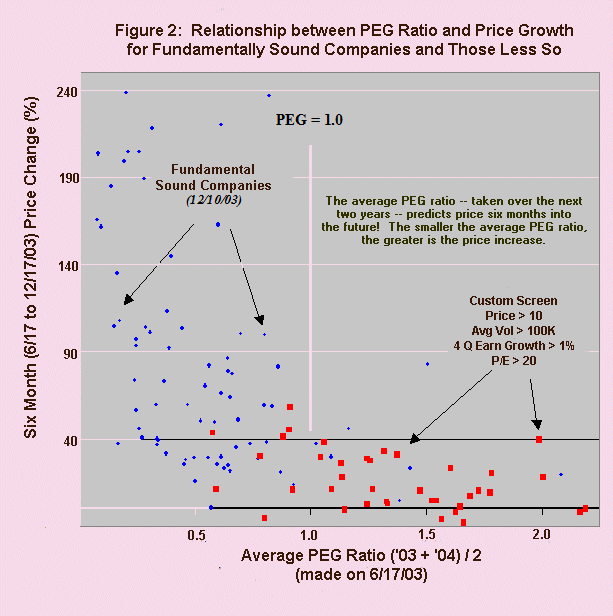
Peter Lynch. a well-known Wall Street stock investor and author of the book, One Up on Wall Street . made this ratio quite popular. How does the ratio tell us if a growth stock is fairly valued? Lynch suggests that the P/E ratio of any company thats fairly priced will equal its growth rate. In other words, if the PEG ratio is 1, it is fairly valued. If it is below 1, it is undervalued, and if the number is above 1, it is overvalued.
According to the PEG ratios, CMTL is greatly undervalued, ICO is fairly valued, and SIRI is greatly overvalued. So is finding growth stocks this simple, or is there more we should be aware of?
Important Points of the PEG Ratio
While it would be nice to simply screen for stocks with low PEG ratios and buy, you should be aware of a few shortcomings:
1. Very low annual earnings will skew data.
For instance, if the company is expected to go from making 0.01 per year to 0.10 over 5 years as it moves up from its infancy stages, the 900% growth rate over 5 years is 180% per annum. Although the annual earnings growth is exceptionally high, the absolute earnings increase of 9 cents isnt nearly as significant as a company that went from making $1 to $10 per share. Be careful you are not inadvertently favoring penny stocks by requiring too low a PEG ratio.
2. The PEG valuation is built off expected earnings forecasts.
Will the company really meet these expectations? That is unknown. Empirical data has indicated that growth stocks with high price to earnings have increased volatility with earnings growth. This makes a reliable forecast all the more difficult. An unreliable forecast means the PEG ratio should be taken with a grain of salt.
How can you tell if your company has the ability to achieve high-growth? While there is no definite method, you can look to past earnings growth rates to see if they have been able to earn blockbuster growth in the past. Just remember that past growth does not mean that future growth is imminent, but it will tell you if the company has historical evidence to prove its ability to grow at a fast pace.
3. Always do your due diligence as to the risk of a low PEG ratio stock.
Could the elevated potential reward simply be based on an extremely high risk factor? Or could it be that while the 5 year forecast is high, the earnings are expected to take a major dump over the next year, thereby significantly changing the PEG ratio? For example, if earnings drop over the next year, the P/E ratio may shoot up, and your PEG ratio will similarly climb, making the stock valuation less attractive.
Check your forward P/E ratio, which is based on a one year earnings forecast, to ensure short-term misery is not expected over the next 12 months of earnings. For instance, you may have a trailing P/E ratio of 30% and a long-term growth rate of 30% giving you a PEG of 1. But you notice that a very bad year is expected and earnings will drop in half. Following that, they will recover to reach the 30% growth rate. So if prices stay the same one year from now, your P/E ratio will be 60% with a long-term growth rate of 30%, giving you a much higher PEG ratio of 2. In other words, just make sure the PEG ratio is not artificially low and is likely to rise in the near future due to an expected short-term slide in earnings.
4. Ensure that you have at least a few reputable analysts providing coverage of a stock.
You would like to see many analysts forecasting tightly grouped, high-growth earnings for low dispersion. If there has been a lack of earnings surprises, this means that their estimates are accurate. Low dispersion of estimates and low analyst error will increase your odds of having a highly rated stock hitting its goal.
For instance, 8 analysts of ICO give an earnings estimate of 0.78 to 1.80 per share, which represents very high growth. In addition, over the last 4 quarters, analysts have missed the mark on average by 74%. This makes basing your decisions on the wide range of analyst estimates and low accuracy rate very difficult. Lastly, if analyst coverage is non-existent, you can look to company guidance for future earnings expectations assuming the company has a history of providing accurate and dependable guidance.
Final Word
How have you used the PEG ratio to find winning high-growth stocks? Share your experiences and best tips in the comments.


