Momentum Trading Williams %R Indicator
Post on: 12 Июнь, 2015 No Comment

Williams %R Indicator
Momentum trading can be done using a number of different momentum indicators, but for the purpose of this article, I’ll show you a day trading method I learned long ago using the Williams %R indicator.
This is strictly a method for trading signals and mostly for making quick scalping trades.
The exits are completely discretionary based on the trader’s intuition of current market momentum.
WILLIAMS %R INDICATOR
The calculation of the Williams %R is as follows:
%R = [(highest high over X periods — close)/(highest high over X periods — lowest low over X periods)] * -100
This momentum trading indicator was shared with the trading community by Larry Williams in the 1970’s. It is an overbought — oversold indicator similar to the stochastic indicator.
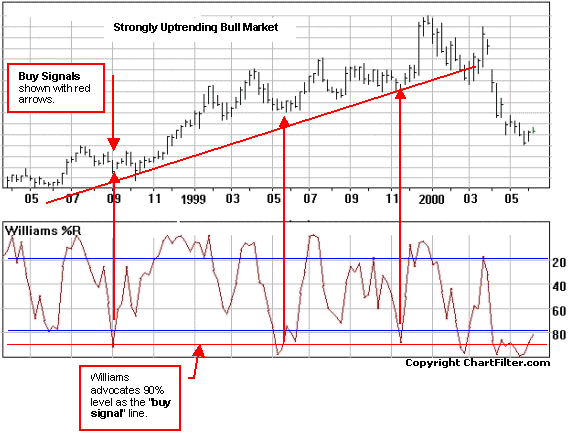
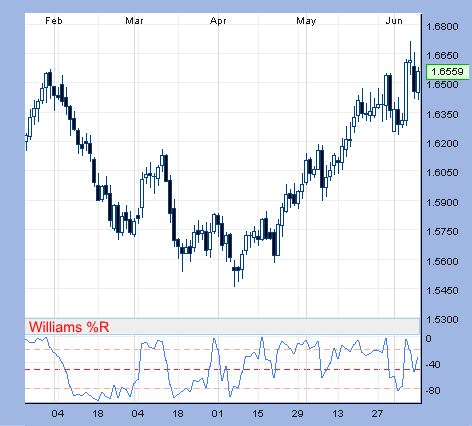
This oscillator is was made to give information about the close of price relative to the high/low range over a certain period of time. The scale ranges from 0 to -100, with a range of -80 to -100 indicating oversold and a range of 0 to -20 indicating an overbought condition.
If the closing price of a bar is near the top of the range, the nearer to zero, or higher the %R will be. If the closing price of a bar is near the bottom of the range, the nearer to -100, or lower the %R will be.
This momentum indicator can of course be used on any time frame and charting software generally have it set to a default period of 14 bars.
Just like many other momentum indicators, during an extended trend, the Williams %R will get pinned down and oscillate about it’s overbought and oversold areas.
Simply because the indicator is in an oversold area does not mean this is a time to buy. In fact, price may very well prove to you that it was just the opposite. a very good time to short.
If you are new to technical analysis and are just starting to take a look at different indicators, some are going to seem very tempting to use right out of he box for simple overbought/oversold trades. I know many won’t take my day trading advice to stay away from that kind of trading, but if you really feel the need to do it, at least learn some really basic testing skills with software like Amibroker or Multicharts first before proceeding. It might just open your eyes to what is possible using oscillators.
Again, if you decide you’d prefer to trade not using indicators and would rather use price only, then head over to my breakout day trading strategies page and check out those methods.
Let’s get to the Momentum Trading Strategy.
COMPONENTS
5 min. Chart
10 SMA of Price
Williams %R Indicator (setting = 14)

MOMENTUM TRADING STRATEGY SIGNALS
This is a simple scalping strategy using a 10 sma of price to determine short term trend on the 5 min. chart. The Williams %R indicator is then used to determine quick impulse momentum thrusts in the direction of the short term trend.
This method is designed to be traded for quick scalps and then you’re out. Not my cup of tea, but there are lots of players out there that love to ring the cash register often for smaller change.
Buy Trigger: Williams %R turns UP
* A signal is also given when %R is already UP, then 10 SMA turns UP
Exit: Discretionary
Short Setup: 10 SMA is falling
Short Trigger: Williams %R turns DOWN
* A signal is also given when %R is already DOWN, then 10 SMA turns DOWN
Exit: Discretionary


