Measuring Active Management The Basics of Active Share and Tracking Error American Century
Post on: 8 Апрель, 2015 No Comment

Most Popular Commentaries
Every investor needs to understand the basics of portfolio management. In a broad sense, portfolio management can be divided into actively managed and passively managed categories. Although we describe both approaches at the outset, we fasten our attention on active portfolio management in this piece. Specifically, we focus on the Active Share and Tracking Error approaches to measuring active management in equities. The goal is to further develop an appreciation for the multi-faceted complexion of active portfolio management.
Active Versus Passive Investing
Active portfolio management utilizes various firm-level and market-based research approaches and analytical techniques to determine buy, hold, and sell decisions for an investment portfolio. Fundamental analysis and quantitative techniques are key elements that figure into how securities decisions are executed in active management processes. Active management is based on the premise that exploitable market inefficiencies exist and can lead to the identification of mispriced investment securities.
Active managers are expected to outperform the corresponding broad market as well as passive strategies tracking that market. Passive investing or indexing involves assembling a portfolio of assets that mirrors the performance of a given asset market or its corresponding index. A key element of passive investment is the belief that asset markets operate efficiently so that investment securities are correctly priced. When operating under the efficient market belief, no need for active management exists.
Which investment approach is best, active or passive, is a huge debate in terms of strength of convictions held, methodologies employed, and the potential investment consequences. Active versus passive investing is continually debated by a wide variety of investors from a vast array of perspectives. Again, our goal is not to weigh in on the broad debate but to further understand how two specific approaches to measuring active management are being carried out and interpreted.
The Active Share Approach to Measuring Active Management
Active Share is a holdings-based measure of active management representing the percentage of securities in a portfolio that differ from those in the benchmark index. The Active Share measure is determined by the absolute differences in portfolio weights for all securities in the portfolio compared to the (appropriate) benchmark. In other words, the managers over- and underweights, relative to the benchmark, are what determines the degree to which a portfolio manager is engaging in active management. Active Share thus captures the uniqueness of the portfolio managers stock-picking activity, relative to the benchmark.
Researchers K.J. Martijn Cremers and Antti Petajisto 1 specifically define Active Share as:
Active Share = | w fund, i w index, i |,
i = 1
where w fund, i and w index, i are the portfolio weights of stock i in a fund and in its benchmark index; the sum is taken over the N stocks in the index and in the fund. 2
The above formula shows how the absolute difference between the funds weight and the indexs weight for all the stocks represented in the fund and in the index is summed and then divided by 2 (multiplied by ). The divide by 2 operation is carried out to ensure the Active Share measure takes on a value between zero and 100%.
Utilizing the Active Share measure, the degree to which a portfolio (fund) is actively managed can be determined. For instance, Active Share = 100% corresponds to a portfolio that deviates completely from its stated benchmark (the portfolio holds none of the securities contained in the benchmark). The converse, Active Share = 0% describes a portfolio with the same securities and weightings as that of the benchmark.
The Active Share measurement, being a holdings-based approach, differs from active management measures based on comparisons of a funds historical returns to those of its benchmark index. One such returns-based measure of Active Management is Tracking Error.
The Tracking Error Approach to Measuring Active Management
Tracking Error is typically defined as the standard deviation of a funds excess returns relative to that of its benchmark. Tracking Error, when measured using historical returns is often referred to as ex-post or realized Tracking Error. The formula for (ex-post) Tracking Error is presented below.
Tracking Error = (r p r b ),
where equals standard deviation, r p equals the portfolio return, and r b equals the benchmark return. 3
Tracking Error, being a returns-based measure of deviation from a chosen benchmark, is sometimes referred to as active risk. As portfolio returns deviate more from benchmark returns, Tracking Error grows in size. A passively managed portfolio is expected to have a tracking error close to zero whereas an actively managed portfolio would have a higher tracking error reflecting greater excess returns deviation.
Tracking Error can be used to gauge active risk for various purposes. One use of Tracking Error is to help determine and identify sources of investment style drift. 4 Another use involves utilizing the Tracking Error measure to construct the Information Ratio, a risk-adjusted performance measure. 5 Like the Active Share measure, Tracking Error should not be relied upon as a stand-alone measure of active management. As we shall see below, besides using multiple analytical measures in studies, some researchers are beginning to combine active portfolio management measures to construct models that add additional insight to our understanding of portfolio management.
Active Management Illustrated in Two Dimensions
Researchers Cremers and Petajisto utilize both Active Share and Tracking Error to construct a simple model showing active management in two dimensions, below.
Cremers and Petajisto reason that differences in portfolio holdings relative to a chosen benchmark have two basic sources, security (stock) selection and factor timing or sector rotation. 6 Active Share, measured on the vertical axis above, is used by Cremers and Petajisto to reflect stock selection. Tracking Error is used to represent the factor timing/sector rotation dimension of active portfolio management. 7
The Cremers and Petajisto model above shows another way to characterize funds or portfolio managers in terms of Active Share and Tracking Error. Although the model is not earth-shattering or cutting-edge in presenting information, it is interesting and offers structure in the way we think about and compare investment approaches. Their model positions Pure Indexing at the origin of the graph above. The four active management approaches summarized by Cremers and Petajisto are presented below.
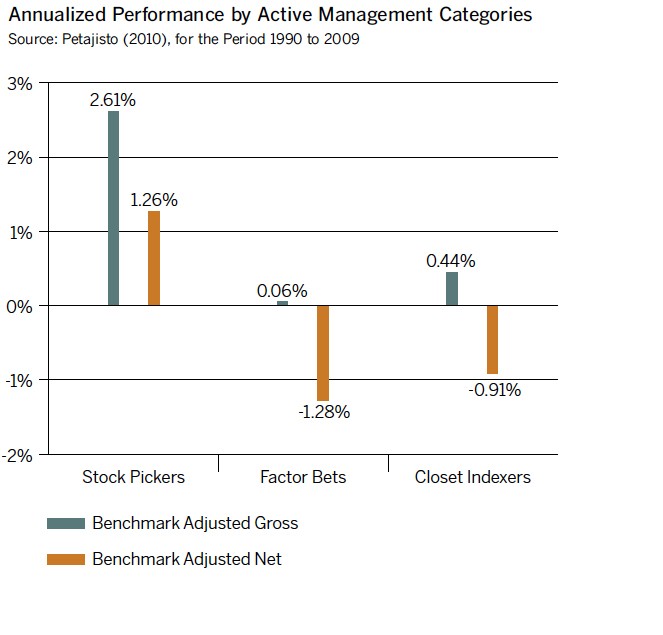
- Closet Indexing tends to display low Active Share and low Tracking Error. This type of portfolio management can result in active-type fees, (higher) in exchange for little more than passive index performance.
- Factor Bets typify managers maintaining portfolios that overweight and underweight systematic factors such as sectors, market capitalizations, or investment style. These managers tend to have low Active Share but high Tracking Error.

- Diversified Stock Picks are indicative of high Active Share but low Tracking Error. These managers tend to take significant stock-specific positions across sectors so that stock position sizes vary significantly from those in the benchmark but overall sector weightings may be similar to the benchmark.
- Concentrated Stock Picks typify managers that take large, stock-specific positions in a few sectors so that both stock position sizes and sector weightings vary significantly from those in the benchmark. These managers tend to have high Active Share and high Tracking Error.
Active Share and Tracking Error, when combined or applied separately, are useful measures for assessing certain aspects of active portfolio management. We would caution against forming judgments around just these two measures, separately or combined in a model. We also advise balance when considering all research results and caution against action on the basis of just one or only a few studies. Lastly, we would encourage close examination of portfolio holdings and stated strategies in order to further understand factors that influence these active management measures and other apects of portfolio performance and characterization.
Ultimately, the validity of an active investment process lies in its ability to exploit market inefficiencies in a manner that can be replicated. While tracking error and active share do not provide this validation, they do show the degree to which portfolio managers deviate from their benchmarks.
American Century Investments offers a wide variety of stock, bond and asset allocation funds. Visit americancentury.com for more information: Individual Investors | U.S Investment Professionals
1 K.J. Martijn Cremers and Antti Petajisto, How Active Is Your Fund Manager? A New Measure That Predicts Performance, Working Paper, Yale School of Management, March 31, 2009. Note: this study has been republished and updated and was presented at the annual Morningstar Investor Conference in March 2011.
2 The calculation is to include weights of all assets in the fund and index, including cash, derivatives, short positions, etc. The discussion in our paper, however, is limited to long-only portfolios of securities such as equities and REIT shares, ignoring cash and derivatives and assuming no leverage is utilized.
3 Standard Deviation (represented by the symbol ) shows how much variation or dispersion exists from the mean average or expected value. A low standard deviation indicates that the data points tend to be very close to the expected value whereas high standard deviation indicates that the data points are spread out over a large range of values.
4 With proper benchmarking, Tracking Error can capture the differing returns one would expect when portfolio holdings deviate significantly from one investment style to another (e.g. in equities, drifting from value to growth style holdings).
5 Information Ratio is a performance measure showing risk-adjusted excess returns; it is the ratio of portfolio returns minus benchmark returns (excess returns) divided by the volatility (standard deviation) of those returns (Tracking Error).
6 K.J. Martijn Cremers and Antti Petajisto, How Active Is Your Fund Manager? A New Measure That Predicts Performance, Working Paper, Yale School of Management, March 31, 2009.
7 Ibid; Cremers and Petajisto argue that because Tracking Error depends on a funds return covariances with the index, it reflects differences in systematic factor exposures. When Tracking Error is expressed matrix notation, the role of weight differences (active bets) and for factor returns can be seen; Tracking Error is the square root of Relative Portfolio Risk, var(a): var(a) = w(a) * V * w(a) where w(a) = active weights, that is, the difference between the portfolios and the benchmarks weighting of a particular factor and w(a) = transposed active weights and V = variance-covariance matrix of factor returns.
The opinions expressed are those of Peter Hardy and are no guarantee of the future performance of any American Century Investments portfolio. This information is not intended to serve as investment advice; it is for educational purposes only.
(c) American Century Investments


