Lottohome price ratio not always accurate measurement for investors
Post on: 28 Июнь, 2015 No Comment

Lot Price Can Get Investors into Trouble
September 2, 2011
A lot-to-home-price ratio is one tool used by investors, builders, and developers to quickly estimate the value of finished lots and raw land. It is a useful rule of thumb calculation that should be done after property-specific cash flows have been completed, but is a very dangerous tool that those new to the industry (and some old-timers too) have relied on to make some very bad decisions.
We have evaluated over 200,000 lots or land related loans in the last three+ years, and we are discussing land values and formally surveying industry experts regularly. Valuation ratios vary widely based on market conditions, the availability of capital, the neighborhood and property-specific development issues.
Here are two recent examples:
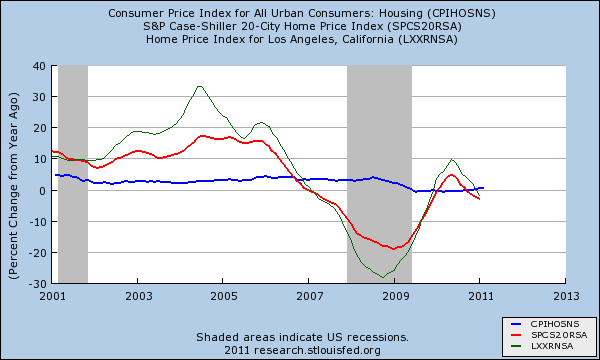
- Lot Values as a Percent of Home Price Decline During a Downturn: During the housing boom of 2004 through 2007, lot-to-home-price ratios increased in many markets across the country as demand for finished lots from public and private builders’ jumped to keep the homebuilding machine running. When the housing market crashed, demand for land came to a screeching halt and these lot ratios dropped as the builders’ strategies quickly shifted to survival mode. We know of several investors, as well as lenders, who assumed that the ratio of land price/home value remained consistent, and made mistakes involving hundreds of millions of dollars.
- Surging Values and Capital: In late 2009 and into 2010, the housing tax credit and other government driven stimuli helped to boost new home sales in several of the better submarkets around the country, and the public builders were able to extend the maturities on much of their debt. The result was the demand for finished lots once again gained momentum, particularly among big builders, and lot ratios climbed rapidly, despite no change in home prices. In some A locations, finished lot values jumped over 50% almost overnight.

Lot ratios are driven by several factors, but are primarily influenced by:
- home prices,
- the level of existing lot supply,
- the level of difficulty of obtaining entitlement and producing new lots,
- the cost of construction, including land development and fees,
- the number of home builders competing for lots, and
- the availability of capital targeting land investment.
Not surprisingly, the high-priced markets with artificial supply constraints such as coastal California, desired areas of Washington D.C. and higher priced markets near job centers in areas such as New Jersey and New York, experience wide fluctuations in lot ratios, which can reach 50% of home price. On the other hand, locations where the supply of finished lots is plentiful or the ability to produce finished lots is quite easy and inexpensive, lot ratios are lower and less volatile. Today, finished lot-to-home-price-ratios in Florida, Texas, and the Midwest tend to be in the 15% to 20% range.
A demonstration of how important it is to understand local market dynamics while valuing land is shown below. Everything starts with determining the appropriate home product and price that would generate a market supported price and sales pace. If the home price is off and the lot ratio is not properly vetted, then the resulting finished lot value can be materially off the mark.
The apparent small differences in home price and lot ratio can translate into a meaningful difference in finished lot values, resulting in a 34% difference in value in the example above. So, while we recognize the benefits of valuing lots or land by the lot-to-home-price ratio method, we are clearly an advocate for taking the time to fully scrutinize the assumptions, and prior to consummating a transaction, conduct a more detailed cash flow analysis to refine the land value estimates. The cost/benefit of doing the proper work cannot be overstated when making land investments. If you have questions about estimating your land value, please contact me .


