Is your business engineered to create wealth Part 3 Capital allocation
Post on: 14 Апрель, 2015 No Comment

Most CEOs would prefer to create more wealth for shareholders than less.
But most companies are not ‘engineered’ to create wealth – internal processes often act to hinder wealth creation, rather than encourage it.
In this article we look at how capital allocation processes can fail shareholders and some simple steps that can be taken to drive greater accountability into investment decisions.
The big capital spends, be they investments in new markets, new products or acquisitions, often represent the signature, transforming achievements of a CEO. And for shareholders, they often have a transforming impact on wealth.
So when faced with these opportunities, CEOs need clear, reliable tools to assess investment opportunities. Unfortunately, the tools that they are most likely to use are anything but.
If wealth creation is the goal of the business, then for any investment evaluation tool to be of use it must address the quality and quantity issues we saw in part one of this series as the key determinants of wealth creation.
This rules out using EBITDA and EPS growth, which both fail to capture the funds invested in a business and say nothing of the quality of the business. Sophisticated investors know this and mark down businesses that trumpet EPS accretion, if the investment fails to deliver reasonable returns on capital invested .
Other, more sophisticated tools, like Internal Rate of Return (IRR) and Discounted Cash Flow (DCF) address the draw backs of EBITDA and EPS by forecasting all the capital required for an investment and all the cash that will be generated by it and boiling them down to a single number; a percentage in the case of Internal Rate of Return (IRR) which can then be compared with the company’s hurdle rate, and a dollar figure in the case of Discounted Cash Flow (DCF), showing how much wealth will be created from the investment.
But while IRR and DCF can be used to accurately calculate the wealth impact of an investment decision, they are only ever as useful as the forecasts used and this is where IRR and DCF analysis fall down.
The best users of DCF look to key drivers, such as margins, volumes and inventory turns to assess the reasonableness of forecasts. If the acquisition requires industry best results across all key drivers to create wealth it’s time to negotiate a better price, or walk away.
But one key reasonableness test every CEO should ask is, ‘What is the forecast ROCE of this investment, in each year of the forecast period?’ If ROCE forecasts are beyond reasonable upper limits then warning bells should sound.
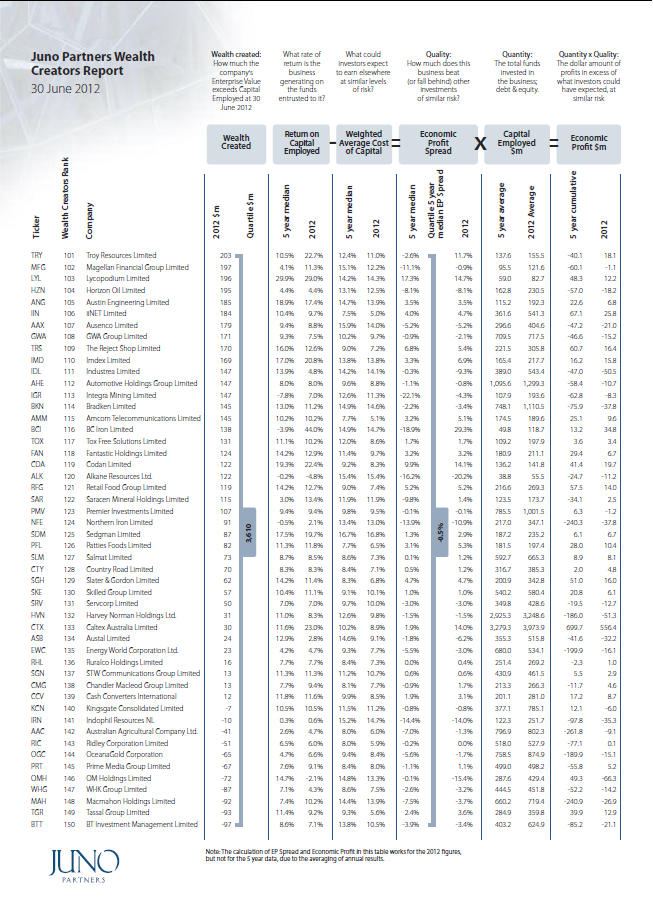
As the chart below shows, drawing on our research into returns achieved by Australia’s largest companies and summarised in the table in part one of this series, only the top 25% of companies are able to sustain returns 5% or more in excess of the cost of capital over any given five year period. This analysis probably understates how rare high returns on capital are in the broader economy, given businesses that have failed or who are yet to be consistently profitable are excluded from our research.
Figure 1: Returns significantly above the cost of capital are rare
In my experience, when DCF analysis is recut to include ROCE and Economic Profit data on an annual basis it often forecasts ROCE starting low and gradually growing larger and larger, past the 75th percentile and eventually into the top decile of what companies have historically been able to achieve.
Few companies are able to generate let alone sustain these returns, due to the competitive forces they face. If one player in a market is able to invest and generate such attractive returns, others will follow and unless the investment is made behind, as Buffett would call it, a deep ‘moat’ of a hard to copy competitive advantage, returns will begin to fall, not rise, as time goes on.
Given 75% of companies fail to make returns more than 5% above the cost of capital. the default assumption for DCF analysis should be that returns will revert to the cost of capital over time, in the absence of a very clear and proven set of competitive advantages that will keep competitors, suppliers and even governments at bay.
Equipped with the forecast annual EP Spread of the investment and a thorough knowledge of the competitive forces of the industry in which the business operates, a CEO is in a much stronger position to make career defining capital investment decisions.
The second and important step in this phase is to close the accountability loop for investment decisions. And that comes back to the performance measure chosen by the CEO. EBITDA and similar measures ignore the capital invested in a business and send a signal to all managers that capital is free.
Economic Profit by contrast, constantly reminds managers of the funds invested in their business and the need to generate sufficient returns. By holding managers accountable for sustained gains in EP, the rigour of investment proposals increases: managers know while putting together their forecasts that unless the investment generates and sustains high returns, the Economic Profitability of their business will fall.
As one client put it, ‘EP is like DCF with a memory’.


