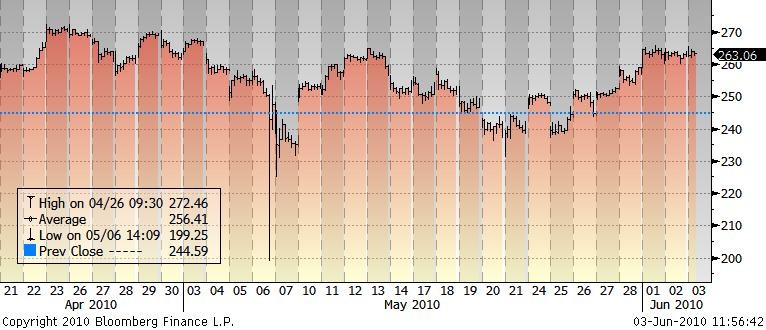
Is Apple undervalued at $260
Post on: 19 Июнь, 2015 No Comment

Yes, says a Romanian mathematician. But not as much as Microsoft.
2C395 /% Click to enlarge: Source: Nicolae Mihalache Ciurdea
Having run-up an even $100 (62%) over the past year, its hard to think of Apple as a bargain at $259.10 a share. But thats how you should look at the stock, according to a historical analysis of Apples share price sent to us over the weekend by Nicolae Mihalache Ciurdea, a Romanian mathematician who teaches at the University of Paris and was one of the blogger-analysts who participated in last weeks earnings smackdown .
He charts Apples AAPL performance over the past 12 quarters using a series of criteria, the most familiar being its trailing price-to-earnings ratio, which fell during the financial crisis from a high of 51.5 in Q4 2007 to a low of 12.8 in Q1 2009 before recovering to just under 19.6 today.
But he quickly moves beyond P/E to more sophisticated measures, namely
- P $/E = The ratio of share price minus cash holdings to earnings
- PEG = Price over earnings divided by annual growth rate
- P $EG = PEG after Apples cash holdings are taken out of the share price
The last two criteria, he argues, are the best way to measure the value of a stock, because a company that is growing rapidly and has a huge cash hoard should be more valuable to investors than one that isnt growing and carries a lot of debt. Historically, a PEG (or P $EG) less than 1 is considered undervalued.
That sounded reasonable to us. So we took Ciurdeas analysis one step further and applied it not just to Apple, but also to Google GOOG. Amazon AMZN. Hewlett-Packard HPQ and Microsoft MSFT. We used Fridays closing price and the most recent quarterly earnings to measure growth year over year.
Can you guess which of the five stocks, by this measure, is the most valuable, and which the least? Answers below the fold.
2C272 /%
All five stocks have PEGs below 1, so can be considered undervalued.
But measured by P $EG, Microsoft at $25.81 is the best bargain and Google at $490.06 is the worst.
Apple is close behind Microsoft twice as valuable at $259.94 as HP at $46.5 and three times as valuable as Google.
UPDATE: At the request of several readers, Ive taken another crack at the spreadsheet, this time using forward-looking EPS and P/E ratios, cash and marketable securities (not just cash) and long-term growth estimates from Thomson Financial. Heres what that looks like:
2C272 /%
In this version which uses different data than Ciurdeas model things have tightened up considerably. Google has zoomed ahead of both Apple and Microsoft, and Amazon has moved into overvalued territory.
In the end, Daniel (deagol) Tello, who helped me work through several iterations of the spreadsheet each with very different results had this to say:
Im sure by now you realize how futile this exercise is. The conclusion of who ends at the top or the bottom in the PEG column is only as good as analysts consensus for next years EPS and the LT growth. AMZN and GOOG used to beat analysts handsomely, except for the last couple of times when theyve come soft or even missed. HPQ and MSFT tend to beat only by a small margin.
AAPL is almost always a huge blowout. Consecutively for the last 27 quarters. Thats almost 7 years.
See also:
[Follow Philip Elmer-DeWitt on Twitter @philiped ]


