Investment Portfolio Strategy Sequence of Returns Demonstrates How Market Volatility Impacts
Post on: 16 Март, 2015 No Comment

Connect with CLA
Update 11/17/2014. This article was updated to reflect minor changes to our investment policy.
Your Investment Portfolio, Market Volatility, and the Sequence of Returns
by Nate Kublank
The impact of our investment policy is based on compounding positive returns and minimizing the frequency of losses. Unfortunately, investors have no control over the order in which the markets will generate returns. This risk is especially concerning to investors who are in or near the distribution phase of managing their investments. However, through prudent portfolio construction we can attempt to produce more consistent returns with less volatility. This basic example demonstrates how a well-run, disciplined investment strategy can produce a favorable outcome by minimizing the risks associated with retiring into a bear market.
A 30-year example of why the sequence of returns is critical
Let’s start our example with a hypothetical portfolio of $2 million in year one of retirement (Figure 1). We will also pick a specific 30-year period of stock market history, 1979 – 2008, which is chosen to illustrate the importance of the sequence of returns. In the first year, the client decides to take a 4.5 percent initial withdrawal (a modest and sustainable withdrawal rate according to some advisors).
Figure 1: A Different Ending Value Experience
Source: Ibbotson 1
Each year in retirement, the individual will increase the annual distribution amount based on the prior year’s rate of inflation. For example, the second year withdrawal would be about $95,670 ($90,000 X 1.063 to account for 6.3 percent inflation in 1979). The third year withdrawal would be about $101,300 ($95,670 X 1.059). This pattern continues throughout the 30 years of retirement. To emphasize the impact sequence of returns can have on an investor’s experience, let’s assume the individual decides to invest the entire value of the portfolio in the domestic large cap equity market.
From 1979 – 2008, the stock market (as measured by the S&P 500) returned 10.99 percent per year. As some may recall, 1979 was a good year in the market, as was most of the following decade. Only one year between 1979 and 1990 (1981) was a losing year for the S&P 500. If we assume our investor retired into this bull market in 1979 and uses the 4.5 percent initial withdrawal plus a raise for inflation each year, the portfolio will generate over $5.6 million in total withdrawals over the 30-year period (Figure 2). In addition, the value of the portfolio at the end of 2008 would have exceeded $23 million (Figure 1). It goes without saying — this would be a pleasant experience.
Figure 2: A Different Income Experience
Source: Ibbotson 2  
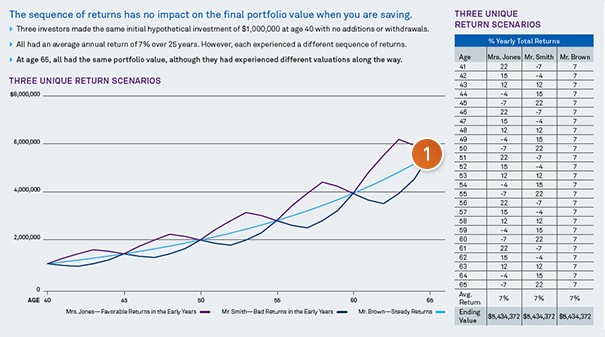
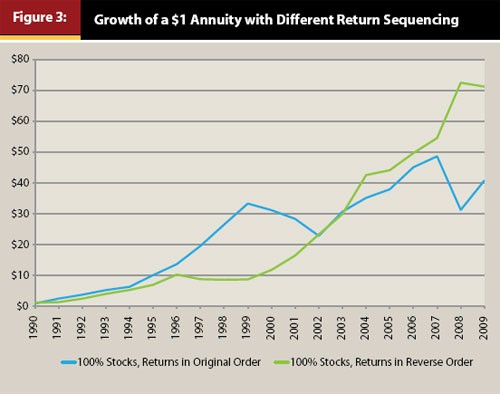
To emphasize that we (nor any other investment advisor) have no control over the sequence of market returns, we’ll contrast this scenario by looking at the exact same 30-year period of returns. This time, however, we simply assume the annual returns were achieved in reverse order. Working backwards, the client retires in 2008 (I’m sure I don’t have to remind most of you what the market did in 2008) when the market was down sharply. As you might expect, the initial 4.5 percent withdrawal, combined with significant loss of investment capital, creates quite a drawdown of portfolio value in the first year. In the seventh, eighth, and ninth years of retirement (in this case, years 2002, 2001, and 2000) were also all substantial down years in the market. Again, we’re looking at the exact same 30-year time period, with the exact same 10.99 percent average annualized rate of return, and the exact same volatility. However, since there was a significant loss of value in year one, followed by further loss of value in years seven to nine of retirement, the dollar-value experience for this investor is much different. Total cash-flow derived from the portfolio under the exact same withdrawal pattern accumulates to about $1.7 million (Figure 2), and the portfolio is completely exhausted in year 13 of retirement (Figure 1).
How can one period of time, which generates the exact same annualized rate of return with the exact same level of volatility, create such a different result? It all comes down to the sequence in which the returns are achieved. In the reverse order scenario, the early years draw the portfolio down so deeply, that the latter years more favorable returns (applied to much smaller portfolio values) can’t make up for the early losses and withdrawals. This stresses the importance of one of our most vital investment philosophies: Seek portfolio construction and investment strategies that have higher probabilities of compounding positive returns, and which are intended to lessen the probability of compounding losses.
Applying sequence of returns to portfolio construction
We attempt to carry out this philosophy by constructing a well-diversified portfolio of different asset classes, and prudently monitoring the allocation to minimize the risk of steep and/or frequent losses. To illustrate, let’s look back to the reverse return order scenario where the client ran out of money in year 13 of retirement. If we simply modify the allocation to include 50 percent large cap stocks and 50 percent long-term bonds, we create a scenario where the investor would draw in excess of $5.6 million from the portfolio, and end the 30-year period with a $2.8 million portfolio value. Not as favorable as the actual return order outcome of the all-stock portfolio, but drastically better than the reverse return order result of the all-stock portfolio — all by simply adding one additional asset class to the investment mix. Even more interesting is the fact that the 50/50 portfolio mix generated a lower annualized rate of return than the 100 percent stock portfolio. In this case, a lower, yet more stable annualized return stream produced a sustainable portfolio.
Now imagine the impact of adding many different asset classes with disparate return streams intended to minimize losses. We feel that this disciplined approach to portfolio construction puts investors in the best possible position to weather unpredictable market return streams, creates more consistent results, and takes advantage of the long-term compounding of positive returns.
How we can help

The next time you’re attempting to evaluate the performance of several different investment managers, be sure to look beyond the annualized rate of return figures. The exact same average rate of return in one case can produce a vastly different outcome in another time period. This is precisely why we feel that you can mitigate the effects of a volatile market with a thoughtfully constructed portfolio and holistic financial planning in order to provide a high probability of meeting your future cash-flow needs and leaving a legacy for the next generation.
1 Reverse return order replicates a bear market followed by a bull market. Analysis occurs in hindsight, bull and bear markets cannot be predicted. Please see endnotes for information about this illustration. It is not possible to invest in an index. Hypothetical examples are shown for illustrative and educational purposes only. Past performance is no guarantee of future results.
2 The use of 4.5 percent for this illustration is not a recommendation of a particular rate; financial advisors and clients should determine the appropriate rate based on individual client situations. Reverse return order replicates a bear market followed by a bull market. Analysis occurs in hindsight, bull and bear markets cannot be predicted. Please see endnotes for information about this illustration. It is not possible to invest in an index. Hypothetical examples are shown for illustrative and educational purposes only. Past performance is no guarantee of future results.
 
Nate Kublank CFP®, CPWA®, AEP®, Senior Wealth Advisor
CliftonLarsonAllen Wealth Advisors, LLC
CliftonLarsonAllen Wealth Advisors, LLC (“CLA Wealth Advisors”)
The purpose of this publication is purely educational and informational. It is not intended to promote any product or service and should not be relied on for accounting, legal, tax, or investment advice. The views expressed are those of CLA Wealth Advisors. They are subject to change at any time. Past performance does not imply or guarantee future results. Investing entails risks, including possible loss of principal. Diversification cannot assure a profit or guarantee against a loss. Investing involves other forms of risk that are not described here. For that reason, you should contact an investment professional before acting on any information in this publication.
Financial information is from third party sources. Such information is believed to be reliable but is not verified or guaranteed. Performances from any indices in this report are presented without factoring fees or charges, and are provided for reference and competitive purposes only. Any fees, charges, or holdings different than the indices will effect individual results. Indexes are unmanaged; one cannot invest directly into an index. Investment Advisory Services offered through CliftonLarsonAllen Wealth Advisors, LLC, an SEC Registered Investment Advisor.
Prior approval is required for further distribution of this material.


