Investing for beginners Risk returns time and diversification
Post on: 1 Май, 2015 No Comment

T ime is a critical factor when considering risks and rewards in investing.
- Some investments look great over certain periods of time and terrible over others.
- The length of time you hold a particular investment can change its risk/reward profile.
- Small percentage differences add up over the long term .
Does this look like a good investment ?
This graph shows the great stock market crash of October 1987. Londons largest companies lost one-third of their value in just a few days. How would that feel?
Heres what happened over the next five years:
The big crash is still visible, on the left hand side of the graph, but UK shares had recovered back to pre-crash levels just 18 months later. The stock market then went basically nowhere for the next three years.
In this case, the best time to invest was when it felt worse – right after the crash !
Past performance is no guarantee of the future. but we cant ignore its lessons.
Today the Great Crash of 87 barely registers on this three decade graph of the FTSE 100:
So do markets always come back if you wait long enough?
Investors in Japan in the late 1980s have not been so fortunate:
More than 20 years later, the Japanese index is still roughly two-thirds off its peak. How long is their long term?
Lets consider a different case. Does this look like a good investment?
This graph shows the progress of a UK gilt fund between 2008 and the start of 2012.
Gilts – UK government bonds – are the safest investment after cash for UK citizens. So a fund invested in gilts should do well, right?
Well, heres how the same gilt fund has done since the start of 2012:
Investors in this less risky fund have lost money. even after reinvesting all the income from gilts.
And heres how the gilt fund has done from 2012 compared to UK shares:
Since the start of 2012, the safe gilt fund (blue) has fallen in value 3%, while the risky FTSE 100 (red) has increased 15%. (Aside: shares have been more volatile.)
I am not making an argument here for shares versus gilts, or vice versa. This is just an example.
Any investment must be considered over different time scales. not just the past month. Safety is relative, and depends on valuation. Things can go down and bounce back, or stay down.
Time and diversification
We dont have a time machine, and we dont have a crystal ball. We cannot invest in the past with hindsight, and we cannot be sure of tomorrows winners.
But we can spread our risk among different kinds of investments (assets).
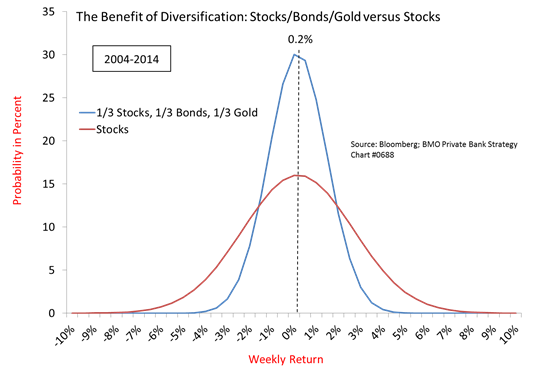
By holding a collection of assets we can smooth out the ups and downs, and maybe turn that volatility to our advantage!
- Recipe for poor returns – Chop and change holdings to chase recent strong performers, and ignore history, diversification, and relative valuation
- Recipe for good returns – Have a plan, stick to it, consider neglected asset classes, remember history and reversion to the mean.
Different kinds of investments – like cash, bonds, property, and shares – are called asset classes. For example, cash is an asset class. Barclays shares are a specific investment within the asset class of shares.
Here is a typical spread of returns from six different asset classes over an illustrative decade-long period:
It doesnt matter what the different assets are here – this is just an example.
The important thing to look at is the shape of the graphs, and the numbers in the following table.


