Inverting The RSI and VIX Strategy System Trader Success
Post on: 16 Март, 2015 No Comment

July 7, 2014 5:00 am 2 comments Views: 1619
Today we look at a readers question and reverse our RSI and VIX strategy to take short positions. Lets do this and see if any edge awaits us.
As pointed out in a previous article, Profit By Combing RSI and VIX , combining RSI and VIX can be a profitable strategy for trading the S&P. If youre not familiar with this simple yet powerful strategy, please take a look at the previous article first. Shortly after the original article was posted a reader asked what would this strategy look like if we reversed the rules and took short positions.
Its an interesting idea and something Ive not tested in many years. Heres why. First of all Im not a big fan of long/short symmetry with trading systems. The difference between market psychology between bull and bear market participants can be huge. Thus, simply reversing long only rules to trade the short side often proves to be ineffective. This may not always be true, but it has been my general observation. Furthermore, based upon past testing I seem to recall that many of the Connors RSI strategies dont do so well on the short. However, its still a great idea to test.
The Orginal Rules (Long Only)
As a reminder here are the orginal rules for taking long trades.
- Price must be above its 200-day moving average
- RSI(2) on price must be below 30
- Buy when RSI(2) of the VIX is above 90
- Exit when RSI(2) of the price rises above 65
Just as a reminder Im going to reproduce the original equity curve below so we can compare it with our new shorting based equity curve.
Original rules. Long only during bull market.
New Rules (Short Only)
Here are the new rules, inverted for taking short trades.
- Price must be below its 200-day moving average
- RSI(2) on price must be above 70
- Sell short when RSI(2) of the VIX is below 10
- Exit when RSI(2) of the price falls below 35

Environmental Settings
I coded the above rules in EasyLanguage and tested it on the S&P cash market going back to 1983. Before getting into the details of the results let me say this: all the tests within this article are going to use the following assumptions:
- Starting account size of $100,000.
- Dates tested are from 1983 through May 30, 2014.
- The number of shares traded will be based on volatility estimation and risking no more than $2,000 per trade.
- Volatility is estimated with a five times 10-day ATR calculation. This is done to normalize the amount of risk per trade.
- The P&L is not accumulated to the starting equity.
- There are no deductions for commissions and slippage.
- There are no stops.
Please note we are not adding our profits to our trading account! We are always trading a small percentage of our starting capital. Thus, the results demonstrated here are very conservative and it would be easy to generate much higher returns.
Here is the position sizing formula used:
Shares = $2,000 per trade / 5 * ATR(10)
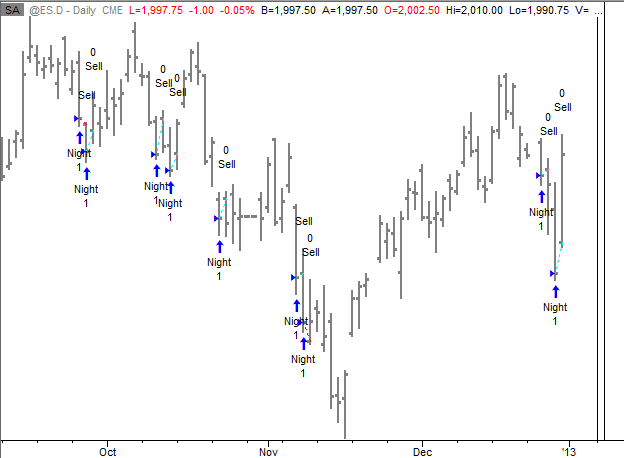
For an example of what the trades will look like on a daily chart, below is an image of a couple of trades. Those short trades were opened when the VIX-based RSI fell below 10.
Baseline Results
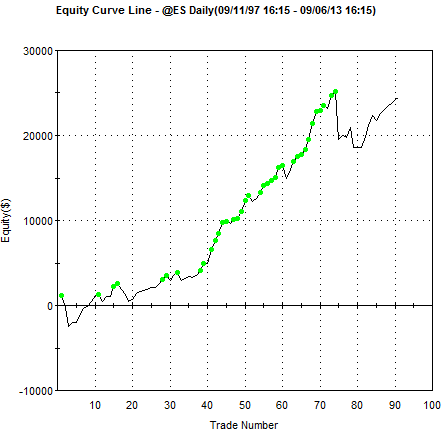
Below is the equity curve for trading the S&P cash index based upon the rules as defined above.
Going short during bear market.
Well, we do have a rising equity curve but its not very impressive. First, there is just over 60 trades which is not very many given the number of years of historical data. The original bull version had around 190 trades. Second, you will notice for many years the system was in negative equity. Not until around 2003 did the system start to produce positive equity. Both of these observations are most likely due to the strong bullish tendency of the U.S. stock market over the past few decades. Shorting the broad U.S. indexes has fewer opportunities and its not as simple as reversing the original bullish rules.
One example of a successful shorting system for the broad U.S index is a system called the Simple Shorting System . Take a look at that article for an interesting shorting strategy along with how to combine it with a long strategy.
Getting back with our shorting strategy
Going Long In A Bear Market
What would happen if we simply go long during a bear market? The original rules called for taking trades only when the daily price is above the 200-day moving average. Lets turn that around and go long only when price is below the 200-day moving average. Below is the equity curve.
Going long during bear market.
This looks a lot better. Even going long during a bear market produces better results than going short. The system is finding high probability points where the market snaps back. When you compare the above equity curve with the original rules you can clearly see taking trades above the 200-day moving average produces a much smother and more dramatic equity curve.


