Intermarket Sector And Seasonal Equity Analysis
Post on: 10 Июнь, 2015 No Comment

Overview
Below is a summary of current intermarket, sector, and cyclical analysis of U.S. equities. The evidence points to a very near-term bullish outlook (couple of days to a couple of months), and extreme bearish long-term outlook (1-12+ months). There are a variety of technical patterns also present, however, only major trends and basic technical indicators have been included.
Intermarket Analysis
- Break of summer 2011 S&P500 (NYSEARCA:SPY ) uptrend evident in daily chart.
- Negative Divergence in MACDs on weekly S&P 500 chart and rising wedge pattern typically leads to downside breakout. Combination of the two is extremely bearish.
- Similar conclusions evident in Dow Jones Industrial Average (NYSEARCA:DIA ) (bearish rising wedge and negative divergence in MACDs) on weekly chart.
- Similar break in Nasdaq (NASDAQ:QQQ ) uptrend on daily chart.
- In the weekly Nasdaq chart (and other indices), the bullish uptrend is still holding. Significant support lies between 2400 and 2500, and 2500 was maintained on Friday’s sell-off prior to its reversal. Any future tests of this level will have bearish implications.
- Failure of the Russell 2000 (NYSEARCA:IWM ) to confirm April and September S&P/DJIA/NDX highs has negative connotations for equities.
- There also is negative divergence again evident in MACDs. A breakout in the ascending triangle to the downside would be bearish.
Sector Analysis
For anyone unfamiliar with sector rotation, tech tends to be a leading sector. Industrials, basic industry, energy, and staples lag market action (often in that order). Strength in basic industry, energy, and staples, accompanied by weakness in tech, is very indicative of a market top. The relative strength of these markets is most clearly demonstrated through the use of ratio charts.

- Leadership in Technology stocks has collapsed. There was significant underperformance in October and November, as illustrated by major break out of the upward channel. Weakness in tech and the breakdown of the uptrend is highly indicative of a market top.
- The Industrial sector (NYSEARCA:XLI ) is already showing relative weakness since summer 2011.
- Basic Materials/Industry (NYSEARCA:XLB ) looks to be breaking out of a downtrend — further confirmation of a market top being put in place (this sector usually exhibits strength near tops).
- Energy (NYSEARCA:XLE ) is consolidating around downward resistance. This is in line with sector rotation, and appears to be approaching a breakout.
- Staples (NYSEARCA:XLP ) are consolidating in a bullish flag pattern, which typically breaks to the upside, leading to a continuation of the prior trend. A breakout would confirm the market top is in place.
- Keep in mind these are ratio charts, and an upside breakout in staples means a relative outperformance of the broader market. Outperformance can take place on negative absolute returns.
- The Russell 2000 has been underperforming the S&P500 since the summer of 2011 and looks ripe for a downside breakout, which would confirm a market top (small caps often lead the market).
Cycle Analysis
Presidential Cycle: Bearish
The first two years of American presidential cycle are historically weaker than the second two years.
- The week prior to American Thanksgiving is historically strong in part due to low volume that favors higher prices.
- November and December are historically the strongest months for equities (Santa Clause Rally).
Other
- Quantitative Easing is producing diminishing returns.
- Extended (secular) bear markets do take place. The problem is that when they occur, people are unprepared given the duration since the previous one. Given the extraordinary bull market of the 80s and 90s, it is not overly pessimistic to expect a continuation of the secular bear market we are currently in.
Conclusion/Current Outlook
Short term: Bullish
- Large sell-off that concluded on Friday put prices in a largely oversold position
- Seasonal patterns suggest higher prices
Long Term: Bearish
- Major indices are indicating weakness
- Sector rotation seems to be confirming market top
- The January Barometer could likely be fulfilled — a negative January followed by an even worse 2013. This would be in line with the presidential cycle.
Investment Ideas
1) Equities
- In any period of uncertainty, cash is never a bad option. Despite the sell-off from the September highs, equity markets are still at historically high prices, and it may be a good time to take profits.
- For those looking to stay invested, staples looks ripe to outperform, and may be a safe way to maintain some equity exposure. The XLB eliminates any company specific risk and offers exposure to the sector.
- For aggressive investors or those with shorter time frames, look for rallies on low volume for shorting opportunities.
- For those that outright disagree with the long-term bearish thesis of this article, place stops to protect your capital. A downturn similar to that of 2008 can not be ruled out.
- A second option for those who want to maintain exposure is to buy insurance through the option market (most often through puts).
2) Commodities
- The bear market that began in equities in 2000 coincided with the bull market that began in commodities. Most commodities are still in a secular bull market, and have consolidated over the last couple of years, offering attractive entry prices.
- Gold (NYSEARCA:GLD ) particularly should outperform equities as economies struggle with massive debt. Technically, gold looks strong in the long term, as it broke out of its one-year consolidation
Final Notes
- Attention should also be paid to world equity market indices, as global markets are more correlated than ever
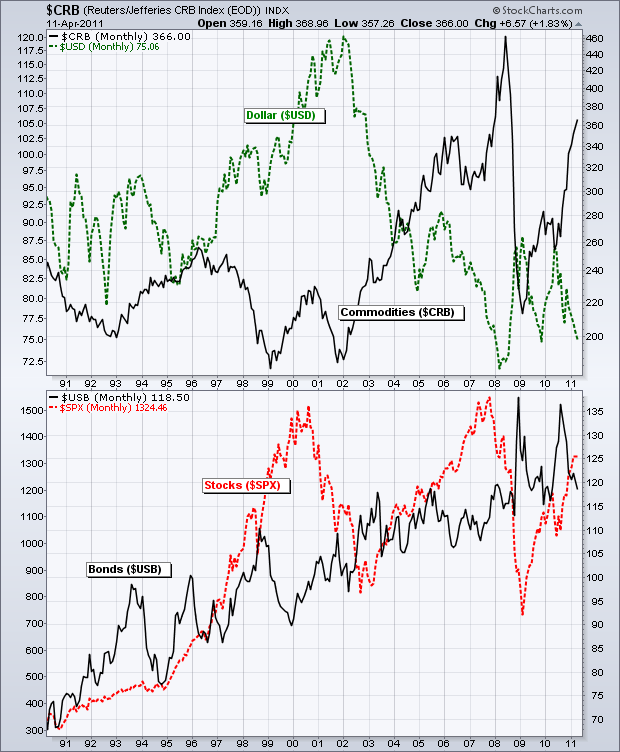
- The above has only looked at U.S. equity markets. A thorough intermarket analysis would also take into consideration other asset classes (bonds, currencies, and commodities), especially the USD.
- Upcoming U.S. capital gains tax implementation could disrupt typically strong seasonal patterns.
- In today’s markets, central bank action is the biggest mover of prices across all asset classes, and must be constantly monitored.
Disclosure: I have no positions in any stocks mentioned, and no plans to initiate any positions within the next 72 hours. I wrote this article myself, and it expresses my own opinions. I am not receiving compensation for it (other than from Seeking Alpha). I have no business relationship with any company whose stock is mentioned in this article.


