How to Calculate Free Cash Flow Correctly
Post on: 17 Май, 2015 No Comment

Nov 19, 2013
Free cash flow — the amount of cash generated by a company not needed to maintain operations — is quite possibly the single most important statistic in business. The purpose of any business is to generate cash for its owners (otherwise, why be in business?). This cash can then be put to work providing value to shareholders in multiple ways: by paying a dividend, buying back shares, or re-investing in the business to grow revenues and profits. No company can survive and thrive over the long term without generating and increasing the amount of cash it generates.
Given this, it is important for investors to know how to calculate free cash flow correctly.
Standard Free Cash Flow Calculation
The textbook calculation is as follows:
Free Cash Flow (FCF) = Net Cash from Operations — Capital Expenditures
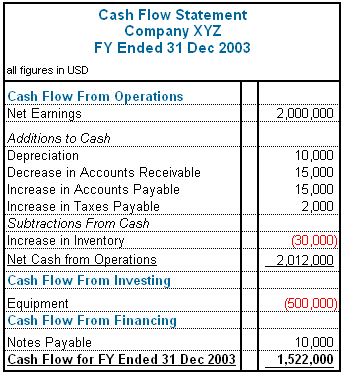
All public companies are required to include a cash flow statement as part of their SEC filings. In this statement is listed the Net Cash from Operations. which is the actual amount of cash brought in or used by the companys operations for the reporting period. Capital Expenditures (also in the statement) are subtracted, as these ostensibly represent the cost of maintaining or replacing the assets the business relies on to generate profits. The leftover amount is free cash flow.
Growth vs. Maintenance Capital Expenditures
The problem with the standard calculation is that it assumes all capital expenditures are for maintenance purposes. But this is not the case. Consider current Magic Formula stock Buckle (BKE). a mall clothing retailer. Capital expenditures for this company include the cost of opening and furnishing new stores, in addition to maintaining existing stores. With the standard calculation, we are penalizing Buckles growth investments and understating the actual free cash thrown off by the business.
What we need to do is subtract only maintenance capital expenditures from net cash from operations. The problem is, very few companies actually break out growth from maintenance capital expenditures.
Fortunately, we have an approximation that is always available: Depreciation (often grouped with amortization). Depreciation is the value that past capital expenditures have lost during the reporting period. At the end of an assets life, its full value will have been depreciated and the company will need to pay to replace it. Voila, an excellent estimation of maintenance costs! Consider Buckles past 5 years:
01/2009: CapEx $47m, D&A $22m, 21 new stores, 387 total stores
01/2010: CapEx $51m, D&A $25m, 20 new stores, 401 total stores
01/2011: CapEX $55m, D&A $30m, 21 new stores, 420 total stores
01/2012: CapEx $37m, D&A $33m, 13 new stores, 431 total stores
01/2013: CapEx $30m, D&A $34m, 10 new stores, 440 total stores
As new store openings declined, capital expenditures fell. But depreciation and amortization is linked to the total number of stores. This makes sense — more stores, more maintenance costs.
Modified Free Cash Flow Calculation
One way to incorporate the above into a new calculation is to simply substitute depreciation for capital expenditures, like this:
Free Cash Flow (FCF) = Net Cash from Operations — Depreciation and Amortization
The problem here is, as we see above, capital expenditures can sometimes come in below D&A, due to things like intangible asset and goodwill write-downs. In this case, we should just revert to the standard calculation. Putting it all together, we get:
Free Cash Flow (FCF) = Net Cash from Operations — MIN(Capital Expenditures; Depreciation and Amortization)
Using the above formula, we would use depreciation and amortization to calculate Buckles 2012 maintenance costs ($37m > $34m), but use capital expenditures to calculate 2013 ($30m
Get our stock reviews and other Magic Formula focused content delivered FREE to your inbox. Sign up for the MagicDiligence Newsletter! For a limited time, you’ll also get the FREE report, 5 Quick and Easy Tips for Improving Your Stock Picks.
Get Your FREE Report Now
We will NEVER give out your email address. Period.
Comments
Posted by rrurban on 2013-11-25 13:10:57
Greenblatt and Buffett use owner earnings FCF in their calculations.
OEFCF = Net Income + D&A — Maintenance Capex. Maintenance capex = D+A
In effect, then, OEFCF = Net Income since Maint capex and D+A cancel each other out.
The problem is that net income is after tax, each company has different tax rates, so you cannot compare apples to apples. It also doesn't take into account debt or cash on a company's balance sheet.
EBIT = EBITDA – Capex. A quick and dirty way, according to Greenblatt class notes from Columbia Univ is when you use EBIT you end up getting EBITDA – maint Capex, plus it allows you to compare apples-to-apples for each company.
You can use EBIT/EV = earnings yield, then compare to the greater of 6% or the current 10 yr treasury bond, but always 6% minimum (Buffett).
Look at the S&P 500, sort by EBIT/EV in descending order, then look at which companies Buffett owns. Amazing, also probably a reason XOM was on his list to watch (ranked #12 of 500).


