Free Download EzBackTest FAQ
Post on: 25 Май, 2015 No Comment

FAQ
For more questions and support, send an email: sivansegev@live.com
Intro Video
Q: What exactly is the backtest doing in the background?
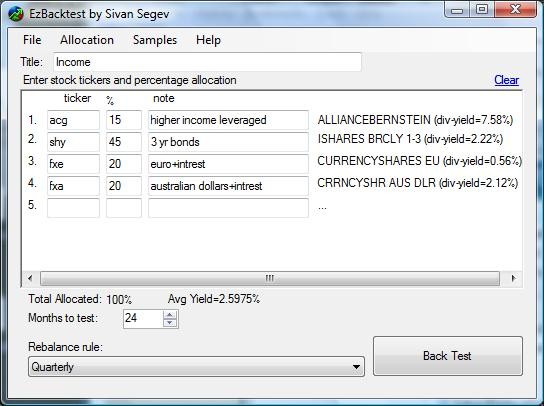
At first, the simulation downloads historic data per each investment option. Then, a virtual portfolio of $100,000 is divided between investment options based on the allocation percentage. The division utilizes fractions of shares.
The simulation tracks changes in investment choices on a daily basis relying on adjusted close value retrieved from historic data. The simulation tracks the daily portfolio value, and reacts to rules to apply rebalancing on desired intervals.
Q: What buy/sell price do you use for the rebalancing options?
Q: Does the simulation utilize dividends information?
Yes. All dividends are simulated as reinvested.
The adjusted closing value in the Yahoo finance history data utilizes dividends and splits to assume all cash reinvested on Ex-Day. In reality, an investor would usually not automatically reinvest, and if he would he would have done so on payment day.
Q: How can an investor perform rebalancing in the real world?
In the real world, not all investment accounts allow rebalancing in the end of the day.
With retirement accounts, theres usually a rebalance tool an investor can use. With mutual funds in investment accounts, usually an investor can request sell to purchase. Stock equity usually has restrictions on usage of cash from unsettled activity, especially in the same day. A margin account would relieve such a restriction but may incur fees.
Q: What are the rebalancing rules?
The rebalancing rules determine when the simulation will readjust investments based on the requested allocations:
Never investment is placed at start of simulation and no selling/purchasing is simulated
Bi-Weekly every other week
Monthly once a month
Bi-Monthly every other month
Quarterly 4 times a year
Yearly once a year
Every 8% drop simulation will keep track of latest peak or rebalance value. On every 8% reduction in portfolio value the simulation will be rebalanced
Every 15% rise simulation will keep track of latest trough or rebalance value. On every 15% above that value, the portfolio will be rebalanced
10% drop, to cash 3 months simulation will keep track of latest peak or rebalance value. On 10% drop simulate holding no investment and no money-market dividend returns. 3 months after cash position will rebalance to portfolio allocation
X% down to cash, y% up to invest simulate active investment strategy. The percentage values can be changed through the options dialog. Select the tools menu, and pick options
Q: How do I enter cash value of stocks that can then be converted to percentage?
When the total allocated value exceeds %100, a green link labeled values to percent appears above the Back Test button. One can enter his real world cash values at the % column, and relevant cash holdings in a line without a ticker.
Q: How accurate is the Dividend Yield value?
The Yield value is extracted from a direct Yahoo or Google quote. This value is restricted to equities only. Mutual funds dividends are simulated but not reported. Thats why when mutual funds are inside a simulated portfolio the Avg Yield may not be accurate. Also, Yahoo finances dividends yield might not be up to date or include non-regular dividends which distort the assumption of expected yield.
Q: I saved a portfolio graph file, but cannot open it although it can be seen in Explorer and opened as XML file in XML viewers. How can I fix this?
The save-file dialog has a bug and sometimes fails to properly save file names with the extension the software designated for it. Rename your file to have the following extension:
pfl.graph.xml
Future versions will use a single word as extension such as .xPortflioGraph
With regards to portfolio files;
Older portfolio files used the extension. pfl.xml
New portfolios are saved with extension. xpfl
Q. What is used as the Risk Free Rate in EZbacktest for the Sharpe Ratio?
The rate is deducted from the reported dividend yield of ETF SHV which represents Short Treasury Bond Index.
Recent versions allow you to set the rate in the options, or set an equity ticker which allows picking different source for dividend yield as risk free yield
Q. My ticker isn’t found when trying to backtest, why?
Data is downloaded from Yahoo!Finance. If there’s an equity ticker that fails for you, you should try to find out how it is accessed in Yahoo!Finance, and try to download historical quotes there directly. If it can be downloaded from Yahoo!Finance, it can be tested with EzBacktest
What is Bull/Bear strategy Simulation? How does it work?
The idea behind bull-bear strategy, is to switch between two or three portfolio based on market sentiment as can be derived from Sentiment signal over the market sentiment by ticker, which is by default the S&P500 index.
So given a Price crosses moving average 2 ovr the S&P500, the simulation will be fully invested in the bull portfolio while the price of the index is above its own SMA2 (default at 200). While the index is under its 200 SMA, the simulation will be either completely uninvested, or invested in a bear portfolio of your choice.
If you choose to add an uncertainty portfolio, then you will be invested in the relevant period in that portfolio.
Seasonal simulation allows you to try out the sell in may theory.


