Financial Strength Ratios for Investment Analysis For Dummies
Post on: 12 Май, 2015 No Comment

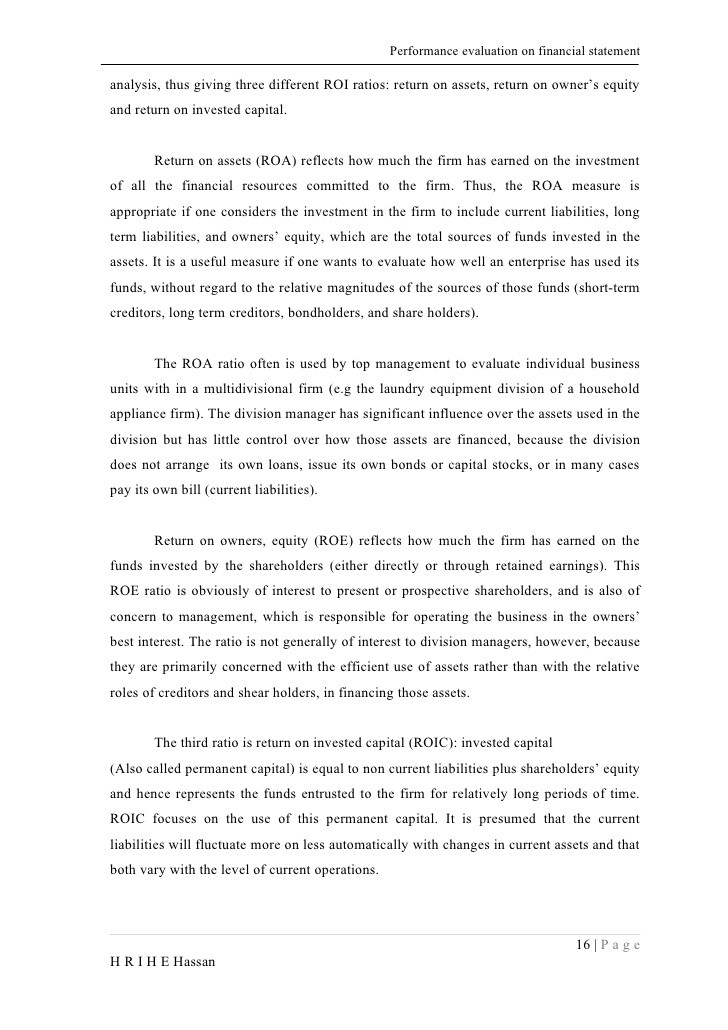
Financial strength ratios go by many names (liquidity. solvency. financial leverage ), but they all point to the same thing: What is a business’s financial strength and position? A balance sheetoriented value investor looks closely to make sure that the company will be around tomorrow. Value investors first look at financial strength ratios for obvious danger.
Current and quick ratios
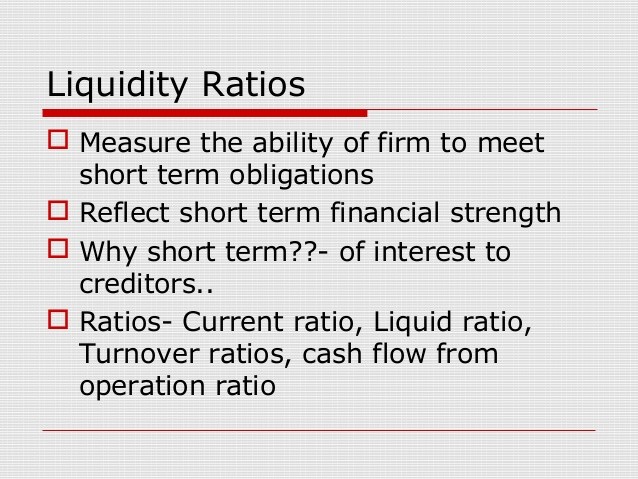
These commonly used liquidity ratios help evaluate a company’s ability to pay its short-term obligations:
Current ratio = current assets / current liabilities
The current ratio includes all current assets, but since inventory is often difficult to turn into cash, many analysts remove it from the equation to arrive at a quick ratio. The quick ratio emphasizes coverage assets quickly convertible into cash:
Quick ratio = (current assets inventory) / current liabilities
The traditional thinking is that the higher the ratio, the better off the company. Greater than 2:1 for the current ratio or 1:1 for the quick ratio is good and safe; less than 2:1 or 1:1 is a sign of impending problems meeting obligations.
The value investor’s general rules for liquidity ratios: First, compare liquidity to industry norms and watch for unhealthy trends. Second, liquidity ratios don’t tell you so much what to buy as what not to buy.
Debt to equity and debt to assets
Sometimes also called solvency. or leverage. ratios, this set measures what portion of a firm’s assets are provided by the owners versus provided by others.
Too much long-term debt costs money, increases risk, and can place restrictions on management in the form of restrictive lender covenants governing what a company can and can’t do. The two most common ratios used to assess solvency and leverage are debt to equity and debt to total assets :
Debt to equity = total debt / owner’s equity
(Note that current liabilities, such as accounts payable, typically are not included.)
Debt to total assets = total debt / total assets
When a company has more debt than equity, yellow flags fly, but industry comparisons are important. Economic value achieved should exceed the cost and risk incurred with the debt. Solvency measures probably deliver a stronger signal for what not to buy than what to buy.
Cash flow ratios

Because cash is really the lifeblood of a business, financial strength assessments typically look at cash and cash flow ratios. But there’s a hidden agenda behind these ratios: to assess earnings quality.
The overall cash flow ratio tells whether a business is generating enough cash from its business to sustain itself, grow, and return capital to its owners:
Overall cash flow ratio = cash inflow from operations / (investing cash outflows + financing cash outflows)
If the overall cash flow ratio is greater than 1, the company is generating enough cash internally to cover business needs. If it’s less than 1, the company is going to capital markets or is selling assets to keep afloat.
It’s best when cash flows march in step with or exceed earnings. If earnings increase without a corresponding increase in cash flow, earnings quality comes into question. Use the cash flow to earnings ratio as a base measure:
Cash flow to earnings = cash flow from operations / net earnings
Because depreciation and other noncash amortizations vary by industry, it’s hard to hang a specific goal on this measure. Consistency over time is good, as are favorable industry comparisons. Further, it’s good when period-to-period earnings increases are accompanied by corresponding cash flow increases.
- Add a Comment Print Share


