Financial Statement Analysis
Post on: 18 Август, 2015 No Comment

Financial Statement Analysis
So far in our accounting education we have studied how to record transactions and how to prepare financial statements. Now we will look at accounting from a user perspective and learn some methods by which we can interpret financial statements.
It’s probably a good idea to begin with a discussion of the objectives of financial statement analysis. According to the Financial Accounting Standards Board, the objectives of financial reporting include:
1. To furnish information that is useful in making investment and credit decisions. Investors are most interested in profitability analysis—future profits, future dividends, future value of common stock. Creditors are most interested in solvency in the short run (are current assets sufficient to pay off current liabilities) and in the long run (can the organization pay off its long-term debt).
2. To provide information useful in assessing future cash flows
3. To provide information about business resources and their financing.
In other words, the objectives vary depending on who is doing the analyzing. In fact, there are many other groups who analyze financials besides investors and creditors—management, unions, and government, to name a few.
There are two principal purposes in analyzing financial statements:
1. Assess past performance and current financial position
2. Assess future returns and related risk
As we shall see, financial statements do a good job of assessing past performance but are less informative about the prospects for the future.
For publicly traded corporations there are many sources of information one can use to evaluate organizational performance including:
Reports published by the company
SEC filings especially 8-K’s, 10-K’s and 10-Q’s
Investment advisory services — Standard & Poor’s, Dun and Bradstreet, Robert Morris Associates, etc.
Stock and bond dealers and brokers
Internet research
Business Periodicals
The tools and techniques we will use to analyze financial statements include:
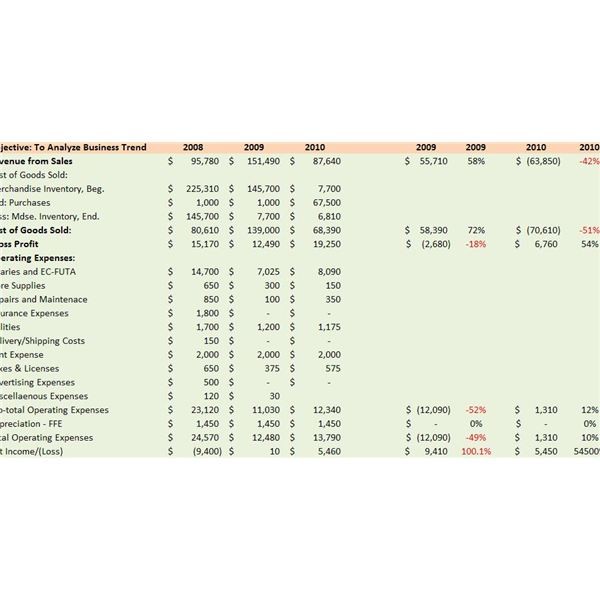
Horizontal analysis including trend percentages
Vertical analysis including common size statements
Industry comparisons and benchmarking
Ratio Analysis
Horizontal analysis can be defined as the study of dollar and percentage changes in financial statements from the previous year to the current year. The formula for the percentage change is:
Base Year $
See Pages 689-691 for a discussion of horizontal analysis. Please go down each item on each financial statement and decide based on the changes in each account whether 2002 or 2003 was the better year.
Trend percentages are a form of horizontal analysis looking at trends over a number of years. The formula for trend percentages is:
Any Year $
Trend percentages relating to Sears. Roebuck and Company are reported on Page 689.
Vertical analysis can be defined as the study of the relationship of each financial statement entry to its logical base. On the income statement the logical base is net sales and on the balance sheet the logical base for assets is total assets, the logical based for liability and stockholder equity entries is total liabilities and stockholders’ equity. See Pages 692-4 for a discussion of vertical analysis. Again go down each item on each financial statement and state whether 2002 or 2003 was the better year.

Common size statements are a type of vertical analysis in which only percentages are shown. Common size statements are an excellent analytical tool when comparing two companies of unequal size.
Ratio analysis is the expression of the relationship of one amount to another amount on the financial statements. We can assess a ratio by comparing it to prior years, to industry averages, to budgeted ratios, etc. However, we must be careful in using ratios. They are just one piece of the puzzle and there is no uniform definition for some ratios so one may be comparing apples and oranges. The authors have divided ratios into categories as follows:
Liquidity Analysis
Profitability Analysis
Solvency Analysis
Please review the ratio analysis section on pages 694-705. The authors begin this section by a brief discussion of working capital. Working capital is defined as current assets minus current liabilities. Generally, the more working capital available the better off is the company. A summary of the ratios discussed appears on Page 705.
Many other ratios are used by financial analysts; however, the above are some of the ratios commonly used to assess performance. For purposes of this course there is no need to memorize the definitions of the various ratios. I would like you understand how each ratio is calculated and be able to calculate it given actual financial data. I would also like you to be able to interpret a ratio and to state whether a high or low ratio is good or bad. I’ll have you calculate ratios from an annual report that I’ll distribute in class so that you get some practice in computing ratios. We’ll also do some work in the computer lab relating to ratio analysis.
Finally, in using the tools and techniques discussed in these notes and in Chapter 13, it is important to use good common sense. Any percentage, ratio, or other number is just one bit of information about the company we are analyzing. We want to know what the big picture is; how top management and the company are performing; how does the company’s performance compare to its competitors and to industry averages; what are the prospects for the future in terms of net income, cash flow, common stock growth, dividend payouts; etc.
On Page 710 there is a short discussion of comprehensive income. A corporate income statement is divided into five categories of income as follows:
Continuing operations
Discontinued operations
Extraordinary events
Changes in accounting methods
Earnings per share
All companies report on continuing operations and earnings per share. They report the results of the other three categories if they apply to the company in the given year.


