Financial Ratios PE Ratio Valuation Ratios
Post on: 16 Март, 2015 No Comment

Financial Ratios — Part 3
Price-to-Sales = Stock Price per share / Sales per share
The good thing about the P/S ratio is that sales tend to be a lot cleaner and less volatile than earnings. Cleaner because they are free of any kinds of accounting tricks that are sometimes used to boost earnings. Less volatile because you’re not dealing with things like one-time charges that can really depress the earnings of a company.
One big flaw of the P/S ratio — sales don’t give you a picture of the company’s profitability. You could make huge sales, but what if you’re losing money on every sale?
So, in essence, P/S can be used as a quick and dirty valuation ratio to compare how a company has done historically. And, perhaps, also to compare similar companies within the same industry. But it should be used with other valuation ratios.
For SWI, let’s assume that the current stock price is $34. From its Income Statement, the number of outstanding shares is 12.3 million (Diluted Weighted Average Shares). In which case:
P/S = 34 / (426.89/12.3) = 0.98
Price-to-Book Ratio:
The P/B ratio is the current stock Price divided by its Book Value (Equity) per share. Equity per share is obtained by dividing Equity by the total number of outstanding shares.
Price-to-Book = Stock Price per share / Equity per share
P/B ratio was important in the past when we had a lot of capital-intensive companies. It made sense then to value companies based on their accounting book value.
But with the huge increase in service firms and other non-capital intensive firms, wealth is created by these companies in terms of intangibles like brand names, processes, databases, etc. Most of these never show up in the book value of the company.
Another thing to be cautious about is the amount that companies book as goodwill. Typically, this is hugely subjective. So if a company shows a low P/B ratio, but has huge amounts booked as goodwill, any changes to this value going ahead will result in a large proportion of the equity or B disappearing.
One last thing about P/B value. this ratio is closely tied to ROE (Return on Equity) discussed above. Given two companies that are similar, a higher ROE typically commands a higher P/B.
The reason you see this happening is because a company with higher ROE can compound its equity at a much higher rate resulting in much faster increase in its equity over time. Such a company would be worth more and would therefore trade at a higher price increasing its P/B.
For SWI ,
P/B = 34 / (187.11/12.3) = 2.2
Price-to-Earnings Ratio:
The most popular valuation ratio of all, the P/E ratio compares the current stock Price to the company’s Earnings.
Price-to-Earnings = Stock Price per share / Earnings per share (EPS)
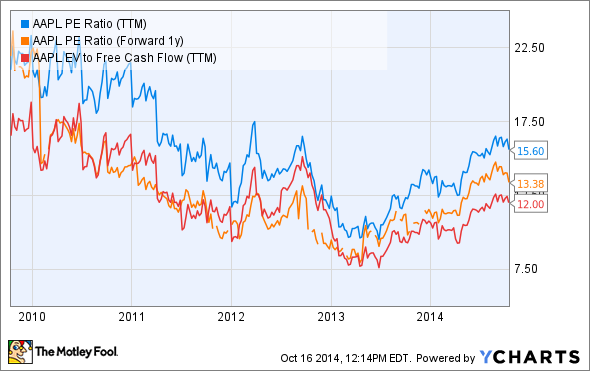
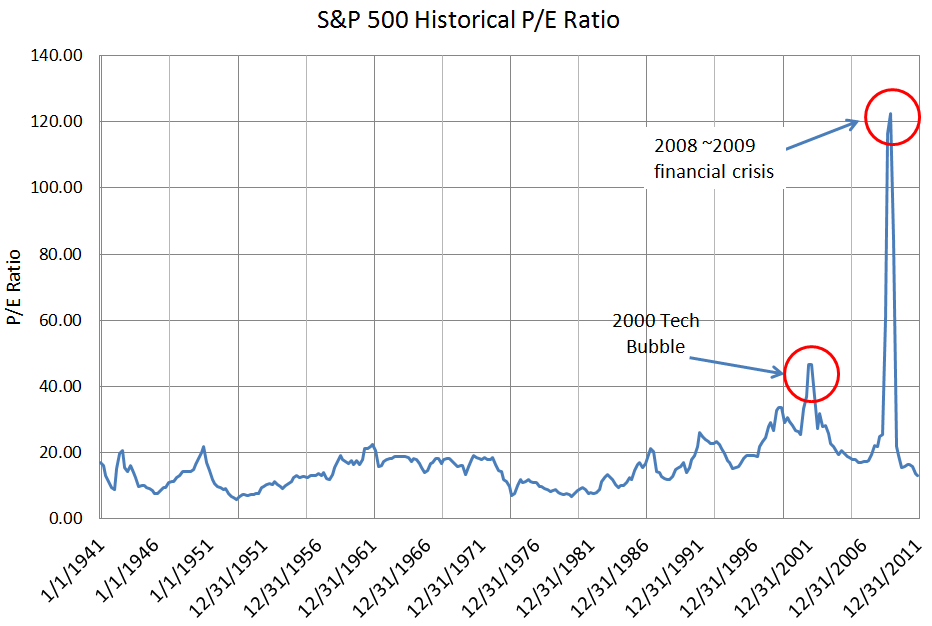
This ratio is useful when you are comparing a company’s current P/E with its historical P/E. If you see a solid company roughly growing at the same rate with about the same business prospects as the past, but now trading at a lower P/E, it is definitely worth analyzing further.

Comparing a company with others in the industry, as well as the entire industry, based on P/E is okay as long as buy and sell decisions are not made from this comparison alone. This is because the P/E ratio suffers from certain drawbacks.
The EPS is based on accounting practices that require assumptions when determining earnings. The earnings calculation is also subject to manipulation at times. For instance, the E could be inflated if the company just sold a business or asset recently.
Also, a lower P/E doesn’t necessarily mean an attractive buying opportunity. A company that’s growing faster without much debt might have a higher P/E than a run of the mill company, but may still be an attractive buy based on its potential to produce future cash flow.
Bottom line. use the P/E ratio carefully. It can serve as an useful guide to compare companies in the same industry with each other and the industry benchmark. However, be aware of the factors that can distort the E in the P/E ratio.
For SWI ,
P/E = 34 / 3.43 = 9.9
where 3.34 is the Diluted Normalized EPS obtained form the Income Statement
This brings us to the end of this extensive series on Financial Ratios. In summary, we looked at the different categories of ratios — Liquidity, Asset Turnover, Leverage, Operating Performance/Profitability, and Valuation.
We’ve discussed in detail the key ratios within each of these categories. We used our SWI example to see how these numbers were calculated for each ratio.
You’re now ready to apply this knowledge to analyzing Financial Statements.


