Financial analysis Solvency Vs Liquidity Ratios
Post on: 12 Май, 2015 No Comment

The concepts: -
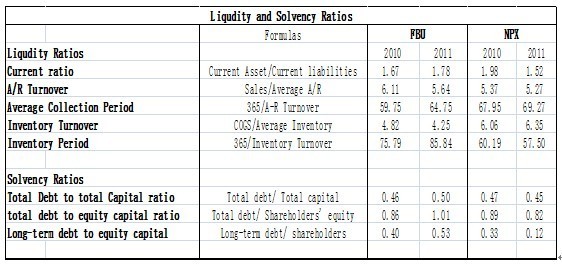
Solvency and liquidity, both of these terms are used to impart knowledge of the company’s financial health. But the real meaning of both of these words are pretty different, solvency in fact refers to a company’s capacity to meet its long term financial commitments. On the other hand liquidity stands for the company’s ability to pay short term obligations. The term also at times refers to the capability of the company to sell its assets quickly in the process of raising cash. A company which has a positive net worth and practically manageable debt load is called a solvent company. In other words a solvent company is one that owns more than it owes. However it has to be remembered that a company with adequate liquidity may have enough of cash to pay the bills, but that would not be very conducive for its total financial help. Thus both solvency and liquidity are equally important, because financial healthy company have to be both solvent and in the possession of adequate liquidity. Analysing the current financial situation in India in accordance with the NSE India data a complete understanding of the company’s health is necessary. To find out the company’s financial health in terms of solvency and liquidity, a number of ratios are to be used.
The ratios: -
The first kind of liquidity ratio that are being used is the current ratio that measures an enterprises ability to pay off the current liabilities that are payable within one year through its current assets such as account receivables, cash and inventories. It is generally assumed that better the company’s liquidities possession the higher should be the ratio. There is also the quick ratio which is also known as the acid test ratio. This ratio excludes inventories from the current assets as it is mainly measuring a company’s ability to meet its short term obligations with its most liquid assets. The last but not the list of the liquidity ratios is the day’s sales outstanding or DSO. It is the average number of days that a specific enterprise takes to collect payment after making a sale. It is thus undoubtedly true that a higher DSO would mean that a company is taking too long a time to collect the payment and in the process is time up capital in receivables. These are generally calculated quarterly or annually.
The solvency ratios are also manifold. The first one is the debt the equity ratio which is indicative of the degree of financial leverage being used by the enterprise and gives equal attention to both short term and long term debt. If this ratio is much higher than expected then it means that there are higher interest expenses. If this rise in the ratio continues then it would be quite clear that the company’s credit rating is getting hampered and it would find much more expensive to raise the debt. There is also another ratio called debt to assets ratio. This ratio in particular measures the percentage of the enterprises assets that has been specifically financed with debt.
Conclusion: -
It is thus clear that both these concepts are very important for a company and to get an in-depth understanding of the company’s financial health. If an investor is looking forward to invest in any specific company in NSE India, he should be able to use of these concepts to make sure that his investment decision is not wrong.
Related Posts:
Thereal time data on Monday, 2nd of December, 2013 showed a rise in the stock market. The index of the 50-share National.
The world of business is quite vast and thus a successful businessman or trader must always know all the various concepts so.
The exorbitant rise: — NSE data shows the enthusiasm that Indians still have for investing in gold. A gold premium in India which.
Infosys, the country’s second largest IT services exporter, today reported a better-than-expected net profit for the quarter ended December 31. The announcement saw.
The rupee was trading at 61.92/93 versus its close of 62.07/08 on Thursday. It hit a low of 61.8750 earlier in the.
Indian markets are likely to trade in a range with a negative bias on Thursday tracking muted trend seen in other Asian.


