Fibonacci Trading Introduction to Fibonacci Analysis
Post on: 16 Март, 2015 No Comment

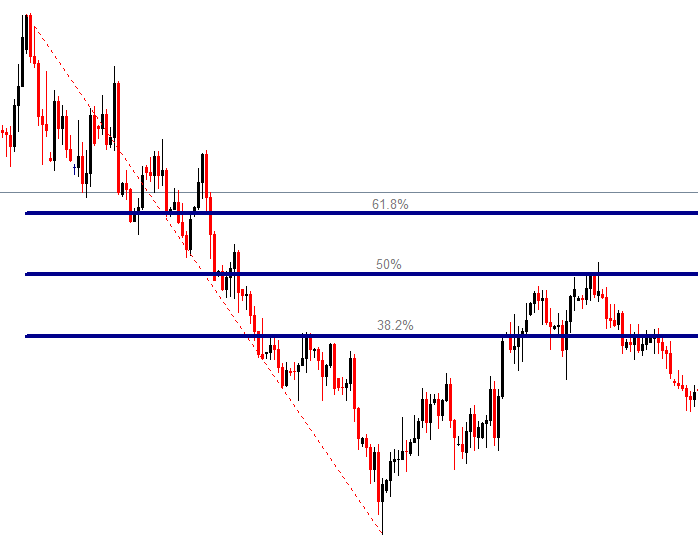
Many of you who follow the Stock Option Assassin know I like to use Fibonacci Analysis in my technical analysis of charts. I get a lot of questions about why I use certain ratios, why I draw Fibonacci grids from certain swing lows to swing highs and not others, and also get asked how to use Fibonacci levels to enter and exit trades. So I thought it would be good to cover some Fibonacci techniques I use over the course of a few posts to help people understand how you can harness the predictive power of Fibonacci Analysis.
The way many traders use Fibonacci Analysis in stock charts is by looking at Fibonacci retracements to find potential support or resistance in a trending stock or ETF prior to the support or resistance showing itself. In other words, use Fibonacci retracements to predict support and resistance which cannot be seen using other charting methods. Whatever charting software you use most likely has Fibonacci tools built in which has helped increase its popularity over the years.
Since this is the first post in the Fibonacci Trading series, let’s start from the beginning. If you are not already an email subscriber, please sign up so you know when the next post in the series is released.
Super Condensed Fibonacci History:
An Italian mathematician from the 13 th century named Leonardo Fibonacci of Pisa described a special series of numbers in his book ‘Liber Abaci’. This translates as “The Book of the Abacus”. The Fibonacci sequence is as follows: 1, 1, 2, 3, 5, 8, 13, 21, 34, 55, 89, 144, 233, and so on, where the next number in the sequence is the sum of the previous two numbers. For example, 8 plus 13 equals 21, and 13 plus 21 equals 34.
This number sequence is seen in nature in a variety of ways which gives an element of universal harmony that is expressed through mathematics. The sequence itself isn’t always as important as the ratios and derivatives between the numbers within the sequence. Traders are more concerned with these ratios as opposed to the sequence itself. The famous Golden Ratio is created when you divide any two consecutive numbers in the sequence forwards or backwards. By doing this you end up 0.618 or 1.1618 depending on the order of your division.
In financial markets, the ratios that come out of the Fibonacci sequence are used for retracements and extensions to both predict and project where a trend may reverse. In the next few Fibonacci Trading posts, we’ll cover the important ratios, how to find Fibonacci confluence on a chart, and eventually get into trading strategies which tap into the predictive power of Fibonacci Analysis.


