Emerging Market Dividends DEM Does Value WisdomTree Emerging Markets Equity Income ETF (NYSEARCA
Post on: 30 Март, 2015 No Comment

Summary
- DEM is the largest emerging market dividend ETF.
- Top holdings at the moment include Russia, China and energy.
- DEM has a solid yield of 4.5%, but the fund has a relatively low yield versus other EM dividend ETFs.
Emerging market dividend ETFs are attractive options for investors in search of dividends and growth, but these funds can be quite different in their sector and country exposure. The largest emerging markets dividend ETF, the WisdomTree Emerging Markets Equity Income (NYSEARCA:DEM ), currently has large exposure to Russia, China and energy.
Index & Strategy
DEM tracks the WisdomTree Emerging Market Equity Income Index. The index selects the highest yielding stocks from the WisdomTree Emerging Markets Dividend Index. The top 30% are kept in the portfolio and then weighted by annual cash dividends. This skews the portfolio towards large caps since they make larger dividend payments.
A long-time top holding in this fund was Taiwan Semiconductor (NYSE:TSM ), but it is currently a smaller holding in the fund. Replacing TSM at the top is Gazprom (OTCPK:OGZPY ), with 5.15 percent of assets. Three other Russian firms are top ten holdings and Russian companies make up 20.2 percent of assets. Rounding out the top five in country exposure are China (17.8 percent), Taiwan (11.9 percent), South Africa (11.6 percent) and Brazil (10.5 percent).
Sector allocation is led by financials (25.5 percent), followed by energy (20.6 percent), telecommunications (15.9 percent), materials (12.4 percent) and utilities (7.6 percent).
Performance
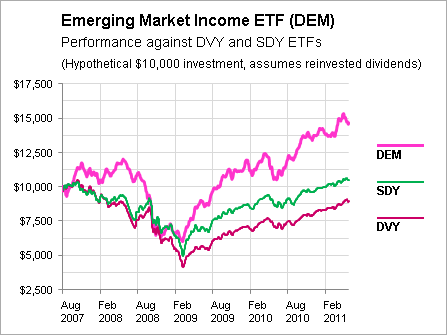
Since inception in July 2007, DEM has gained 18.2 percent, including dividends. On price alone, DEM lost 11.9 percent. iShares MSCI Emerging Markets ETF (NYSEARCA:EEM ) is up 1.3 percent over the same period and excluding dividends, EEM fell 14 percent.
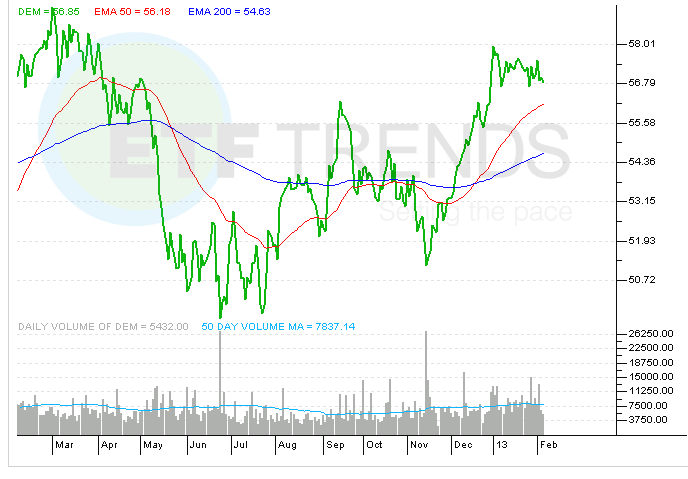
Here’s a chart of DEM over this period, with dividends included.
Here’s DEM versus EEM; a rising line indicates DEM is outperforming.
Since mid-2012, EEM has been in a slight uptrend, but DEM has moved sideways. Recent under performance in DEM is due to the overweighting of Russia and energy relative to EEM.
Expenses
DEM has an expense ratio of 0.63 percent. Considering it is an emerging market dividend ETF this isn’t a high expense ratio, but it is higher than an emerging markets market-cap weighted index fund.
E*trade customers can trade DEM commission free.

Income
DEM had a 30-day SEC yield of 4.65 percent on November 5, 2014; it pays quarterly.
Dividends suffered in 2008 like many funds, but the recovery was also strong. Pre-crisis dividends were high in part due to high commodity prices.
Risk & Reward
A big factor in emerging markets performance is cyclical trends in currency markets. Historically, emerging markets have benefited and suffered from pro-cyclical moves in the currency and asset markets. Both the currency (versus the U.S. dollar) and asset prices move up together when foreign investors buy and then down together when foreign investors sell. This is the opposite of the U.S. market, where a rising dollar will often accompany a falling stock market and vice versa. That wasn’t true in the late 1990s, but that was also a period with the Asian Crisis and Russian default-not an example of emerging market strength. Exacerbating the trend is the large resource sectors in some economies, which makes them extra sensitive to a strong U.S. dollar rally that depresses currency prices.
Here’s a look at WisdomTree Dreyfus Emerging Currency ETF (NYSEARCA:CEW ) and the U.S. Dollar Index, the former at a major support line and the latter at a major resistance line. The Asian Dollar Index shows a similar pattern as CEW.
DEM has a 3-year beta of 0.87 when compared to the MSCI Emerging Markets Index. It has a 3-year standard deviation of 14.06, making it less volatile than EEM, which has a standard deviation of 15.47.
Although DEM is heavily invested in sectors such as telecommunications and utilities, these aren’t necessarily the slow growth sectors they are in developed economies. Many countries are still building basic infrastructure and even infrastructure powerhouse China is still building power plants at an incredible rate.
DEM’s 4.5 percent yield is high, but at the lower end of emerging market dividend ETFs because DEM weights by cash dividends.
DEM is currently invested in Russian energy and Chinese banks, both of which are cheap on a historical valuation basis. Russia is facing a political and economic confrontation with the West, while oil prices simultaneously sink. In China, banks are loaded with non-performing loans that are expected to materialize in the next year or two, forcing banks to raise substantial amounts of capital. These fears may or may not be fully priced in.
Conclusion
DEM is a solid dividend ETF covering emerging markets. When comparing DEM to EEM or other emerging market ETFs, the main differences come down to sector and country exposure. Morningstar has DEM’s price-to-earnings ratio at 8.30, well below the category average of 12.10. This is due to DEM holding beaten down Russian and Chinese shares.
Since DEM has a lower yield than competitor funds, the main issue today is whether an investor wants to own a value fund with heavy exposure to Russia, China and energy.
Disclosure: The author has no positions in any stocks mentioned, and no plans to initiate any positions within the next 72 hours. (More. ) The author wrote this article themselves, and it expresses their own opinions. The author is not receiving compensation for it (other than from Seeking Alpha). The author has no business relationship with any company whose stock is mentioned in this article.


