Don’t Misuse the PricetoEarnings Ratio Investment U
Post on: 12 Апрель, 2015 No Comment

by Christopher Rowe. Technical Strategist, The Oxford Club Tuesday, September 16, 2014. Issue #2375 Technical Analysis
Are you one of those investors who misuse and misunderstand the most popular measure of market valuation?
If you’re basing your view of the market on the price-to-earnings ratio (P/E), then you’re in danger of being misled.
It makes for good conversation for market pundits in the media because the P/E ratio argument fits really well into a sound bite: The S&P 500 is overvalued because it has a P/E of 19.7 right now and the historic average is 16. So stocks would have to decline almost 20% just to come back down to the historic average .
I rarely watch financial television, but it seems like every time I do, I hear a statement like this that is not only oversimplified but downright misleading.
The P/E ratio is simply the price of the stock divided by its earnings per share. If a stock is at $40 and the company earns $2.50 per share, then the P/E ratio is 16.
Typically, higher P/E ratios suggest that investors expect higher earnings in the future for a company (or the companies in a market index).
In some cases, like in 2008, the ratio can reach astronomical levels as the denominator, earnings, takes a beating.
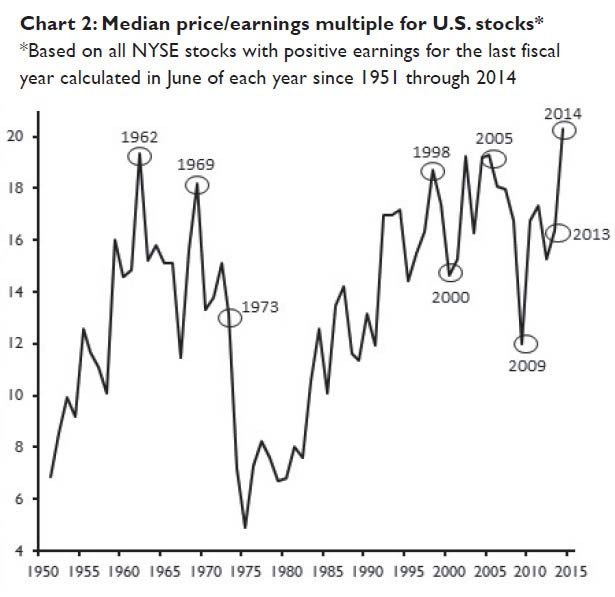
I took a closer look at historic P/E ratios of the S&P 500, going back 88 years.
While the P/E ratio of the S&P 500 tends to stay between 10 and 20, it has traded with a P/E as low as 5.9 (in 1949) and as high as 60.2 (in 2008). Today, the P/E is 19.69.
With a few exceptions, it seems that when the P/E got up around 20, markets were within a year or two of seeing a big decline. When the P/E was closer to 10, markets were often within a couple years of gunning much higher.
But what about the exceptions to this trend?
Staying away from a historically higher P/E ratio would have kept you out of the stock market in the roaring ’90s when the S&P 500 quadrupled and from 2004 to 2007 when it doubled.
One of Marc’s recent recommendations has raised eyebrows among his subscribers. By some measures, shares are expensive. But on the metrics that count, they’re cheap. Readers of Investment U ‘s premium edition are learning about those deeper metrics today. and, of course, discovering the stock. To learn how to join them, click here .
Here’s the Solution
While we can certainly make some use of it, it’s not enough to consider just the average historic P/E ratio.
I saw a segment of The Oxford Club’s weekly video series Market Wake-Up Call where Marc Lichtenfeld really nailed the problem and the solution.
First, Marc makes a couple of great points about the problem. Over the last 100 years the average P/E ratio for the S&P 500 is about 16, he explained. But over the last 20 years, the average P/E ratio is more than 19.

Marc also pointed out that earnings can be manipulated. The P/E ratio is only as good as the quality of the earnings reports.
In addition to accounting measures, earnings can be manipulated when a company buys back its own stock, something that has been happening in near record numbers these days.
To make matters worse, there are five different measures used to calculate the different types of P/E ratios out there. So to quote Marc, Determining valuation is not exactly black and white.
So. Is The Stock Market Too Expensive?
Savvy fundamental analysts like Marc use several ratios together. Marc suggested looking at other market ratios like price-to-book value, price-to-sales and price-to-cash flow. He said price-to-book value is right at the historical average right now at 2.8 times book value. (Note: Marc will discuss one of his favorite measures, price-to-cash flow, in tomorrow’s Investment U .)
Sure, the P/E ratio of the S&P 500 isn’t low, but it can get much higher as stock prices advance. I can’t sum it up better than Marc, who said, With stocks a little pricey these days, you’re paying for that growth.
With the S&P 500 showing a price-to-earnings ratio that certainly isn’t low, it makes more sense than ever to do what Marc does: Focus on individual companies’ growth prospects as well as their valuation compared to their peers. That means comparing the price-to-cash flow, price-to-book value and price-to-earnings ratios to the peer group.
Good investing,
Chris
Editor’s Note: Marc has spent years perfecting his complex, and incredibly powerful, system for discovering great companies at good values. And he uses that system to deliver consistent gains to our Members. But now he’s determined to pull back the curtain and show investors exactly how he does it, in a brand-new investor education course produced by Investment U. Stay tuned for more information.


