Covered Call Writing With Protective Puts A Proposed Strategy
Post on: 12 Апрель, 2015 No Comment

When protective puts are integrated into our covered call writing strategy it is known as the collar strategy. The covered call aspect of the trade generates cash flow and the protective put leg serves as an insurance policy against catastrophic share depreciation. Recently, one of our members, Gary, shared with me a related strategy he had heard about and I thought I’d discuss it with the entire BCI community. On this site we never embrace or reject a strategy approach outright but rather evaluate it from a “pros and cons” perspective and then each of us can make an informed decision as to whether it should be integrated into our portfolios based on our personal risk-tolerance. Let’s break this down the Blue Collar way:
The proposed strategy
- Select a stock or ETF with high implied volatility (like GILD, BIIB, IBB)
- Underlying securities should be large-cap so option open interest is high and bid-ask spreads tight
- Associated options should have weeklys that generate > 1%
- Go 1-2 strikes out-of-the-money for weeklys
- Buy protective puts 6 months out
- Protective puts should be 15 – 20% out-of-the-money (lower than current market value)
- Cost of puts should be no more than 1-month of covered call profits
Theoretical returns
- 1% per week for 6 months = 26%
- Cost of put = 26%/6 = 4.3%
- 6-month theoretical return = 21.7%
- Annualized theoretical return = 43.4%
GILD example
- Real-life price = $102.22
- $85, 6-month put is 17.5% out-of-the-money
- Cost of $85 put = $4.30 (less than 1-month of weekly premiums as shown below)
- The $104 weekly call generates $1.25 which meets the 1% system criteria

Theoretical return per contract for GILD example if share price and premiums remain constant
- (26 x $125) $430/$10,222 = 27.6% = 55% annualized
Advantages of this strategy
The advantages of this strategy are clear. A huge annualized return can be realized based on certain assumptions like share price and short call premiums remaining constant during the 6-month time frame. We also have protection against catastrophic share loss below the $85 put strike. By selecting a 6-month put, the monthly cost of this protection is decreased compared to buying a put each month. In addition to this, there is opportunity to generate additional profit if share price moves up to the strike of the short call.
Potential pitfalls and possible disadvantages of this strategy
Trading commissions
One of the disadvantages of weeklys is that we have 4 – 5 times the amount of trading commissions compared to monthlys. Assuming a reasonable fee of $10 per trade, that computes to $260 for the 6-month time frame, assuming 1-contract trades. Let’s add $20 in commissions for the purchase of the shares and then put. Therefore, over the 6-month time frame, the short calls must overcome a net debit of $430 + $280 = $710.
When do we breakeven?
Based on a weekly premium of $125, we breakeven after 6 weeks. Keep in mind that we paid $102.22 for the shares and we are using a security with high implied volatility as defined by the proposed strategy. If share price declines (we must be prepared for this) we start losing money and we will not break even for 6 weeks.
What about management techniques?
For traditional covered call writing we are managing two positions: the long stocks and the short call. In the proposed strategy, we are also managing the long put position. The investor must be capable of managing all 3 positions. In addition to this, if share price moves above the short call strike, we must roll the option in order to retain share ownership. This will most likely impact our $125/week premium goal as the time value of a short call will decline as the strike moves deeper in-the-money. Rolling out and up may actually result in a short call debit. Rolling will also result in more trading commissions further eroding the profits from a theoretical trade.
What about earnings reports?
Two times within the 6-month time frame, there will be an earnings announcement. I strongly believe that a short call should not be written in those 2 weeks, thereby decreasing returns from the theoretical stats we archived above. The strategy, however, does require us to retain the shares through these two earnings reports and that may result in a dramatic share decline if the report (s) is disappointing. Now we are protected below $85 because of the long put but there’s a lot to lose between $102.22 and $85.
What about dividends?
Of the three securities mentioned by Gary, IBB does distribute a quarterly dividend. Although unlikely, there is the possibility of early exercise, when expiration occurs after the ex-dividend date. Should the shares be assigned because of the ex-date, new shares would have to be purchased at the current market value and who knows how this would impact our theoretical returns. There are ways to avoid early exercise resulting from ex-dates but that would involve sophisticated management skills and would not be guaranteed.
What is the basis for selecting the underlying security?
For traditional covered call writing (according to the BCI methodology) a stock or ETF is chosen based on three factors: fundamental and technical analysis as well as common sense principles like minimum trading volume and avoiding earnings reports. In this proposed strategy, it appears that the main criteria for selection is option returns and liquidity. Quantity seems to take precedence over quality.
What about the 6-month time frame?
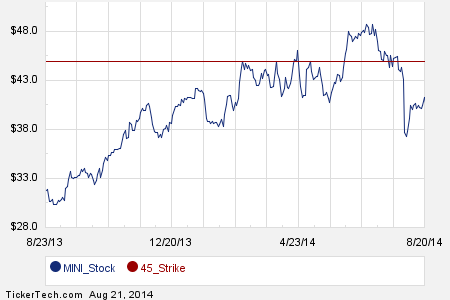
We enter a trade today because certain system criteria are met such as those mentioned at the top of this article. By undertaking a 6-month obligation, we are making the assumption that those same positive factors will be in place for half a year. We should at least be prepared that this may not come to fruition as shown in the chart below:
GILD: price movement impacting strike selection
Discussion
There are many ways to make money in the stock and option markets. The proposed strategy may be one of those ways for certain investors. One key point is that there are no free lunches and every strategy has its advantages and disadvantages which must be evaluated before risking our hard-earned money.
Another positive week of economic reports supported an advancing stock market:
- Minutes from the October 28 29 FOMC meeting revealed that the Fed plans to keep interest rates near zero. An improving economy was noted but so were concerns of low inflation
- The Conference Boards Index of Leading Economic Indicators rose by 0.9% in October, above expectations, the 13th increase in the last 15 months
- Industrial production declined by 0.1% in October, below the + 0.2% anticipated
- Manufufacturing, in general, was up 0.2% in October
- New housing starts declined by 2.8% in October but are still up 7.8* from a year ago
- Housing permits were up 4.8% in October, the highest monthly increase since July and higher than a year ago
- Sales of existing homes in October increased by 1.5% and for the first time in 2014 was higher year-over-year and at its highest pace since September, 2013
- The median price of existing homes in October rose to $208,300, a 5.5% increase from October, 2013. This marks 32 consecutive weeks of year-over-year increases
- The Producer Price Index (PPI) increased by 0.2% in October and by 1.5% year-over-year
- The CPI was unchanged in October. Inflation is up 1.7% year-over-year, below the Feds 2% target rate
- The Conference Boards Index of Leading Economic Indicators rose by 0.9% in October, above expectations. This was the 13th increase in the past 15 months
BCI. Moderately bullish favoring out-of-the-money strikes 2-to-1


