Cash Flow Ratios
Post on: 12 Апрель, 2015 No Comment

Cash Flow Ratios — Measuring The Flow
In many cases, cash flow ratios signify a more accurate measurement of a stock’s value than the price to earnings ratio. P/E. A company’s ability to generate cash flow is one of the most important indicators of its health. Although much is said and written about P/E, it is not able to give you an accurate representation of a company and its efforts to generate cash flow. Because cash flow ratios examine the flow of money into a company, it can help to identify struggling companies and in turn, struggling stocks .
Price to earnings is perceived as being a very important ratio. When a company’s P/E is very high or low, it usually makes a splash on the financial pages. Understand one thing; the price to earnings ratio is a valuable metric and can help a successful investor with his or her stock technical analysis. but it is only one technical analysis tool and should be considered as such. While the same can be said for each of the cash flow ratios, these give insight into the money coming in and going out of a company. A company can demonstrate earnings, but if more money is pouring out of a company than pouring in, there will be fiscal problems in the future.
Since we have identified the importance of cash flow ratios, how do we calculate them? The two cash flow ratios that we will examine are price to cash flow ratio and free cash flow ratio. Each of these technical analysis tools looks at the flow of money in a different perspective, but both are indicators of whether a companies stock is over or under-valued.
Price to Cash Flow Ratio
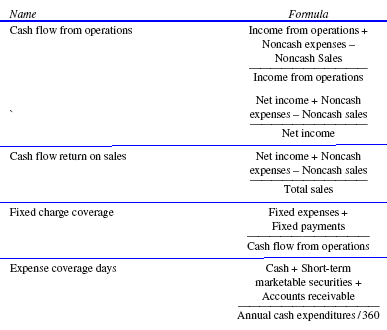
The price to cash flow ratio is determined by dividing the stock’s price by cash flow per share. The reason many prefer this measurement is because cash flow is used instead of net income (found when computing earnings per share). Cash flow is calculated by taking the company’s net income and adding back the depreciation and amortization charges. The cash flow is then divided by the number of shares and the result should be a positive number. A negative number indicates that the company is burning cash and buying shares of such companies could result in many investing mistakes .
Free Cash Flow Ratio

Free cash flow ratio is a refinement of cash flow that goes a step further and adds one-time expenses capital expenses, dividend payments, and other non-occurring charges back to cash flow. The result is how much cash the company generated in the trailing twelve months. It is possible to divide the free cash flow by the current price per share and the result describes the value the market places on the company’s ability to generate cash. Such analysis allows the wise investor to make a more accurate evaluation of a company and successfully accomplish value stock investing .
Conclusion
Like the P/E ratio, both of these Cash Flow ratios suggest where the market values a company. Lower numbers relative to its industry and sector, suggests the market has undervalued the stock. Higher numbers than its industry and sector may mean the market has overvalued the stock. Thankfully for the mathematically challenged, you don’t have to do all of these calculations. Many sites on the Web include these numbers for your review. Like all ratios, they don’t tell the whole story. Be sure you look at other metrics to verify relative value. However, these Cash Flow ratios can give you significant clues to how the market values a stock.


