Buy High Sell Higher
Post on: 19 Апрель, 2015 No Comment

There are many market pundits, brokers and investors who have made the argument that it’s impossible to time the market and the key to long-term wealth is to buy good stocks and hold onto them. Certainly recent market history has put a huge dent into this way of investing.
The battlefield is littered with former blue chip companies whose shares have dropped more than 50% in value. In the 1990s buy and hold worked great because the S&P 500 never had a down year with a total return of more than 400%. In this decade the story has been much different. The S&P 500 has had four losing years with 2008 being one of the worst in history. The total return for the S&P 500 with dividends since Dec. 31, 1999 has been -22%.
In our money management business and in publishing our two newsletters, The Chartist and The Chartist Mutual Fund/ETF Letter. we take a purely technical view of the market. Our analysis is based on the price action of the major market averages, the price action of individual common stocks and exchange-traded funds and many widely followed technical indicators.
We use our market indicators to measure the risk in the market. Our proprietary indicators first measure the overall trend of the market averages, which include the Wilshire 5000, S&P 500, Russell 2000, NASDAQ Composite and Value Line Geometric. When these averages are in sync to the upside, we then use our relative strength methodology to sift through more than 7,000 individual stocks and ETFs. If we can identify enough stocks and ETFs that meet our stringent criteria, then we then start investing.
Relative strength is a technical methodology that measures the price action of a given stock or exchange-traded fund against all other stocks or exchange-traded funds. In every bull market, a select group of stronger-than-market stocks or ETFs will invariably emerge as market leaders and will outperform the averages by a wide margin. These are the securities that we want to be invested in.
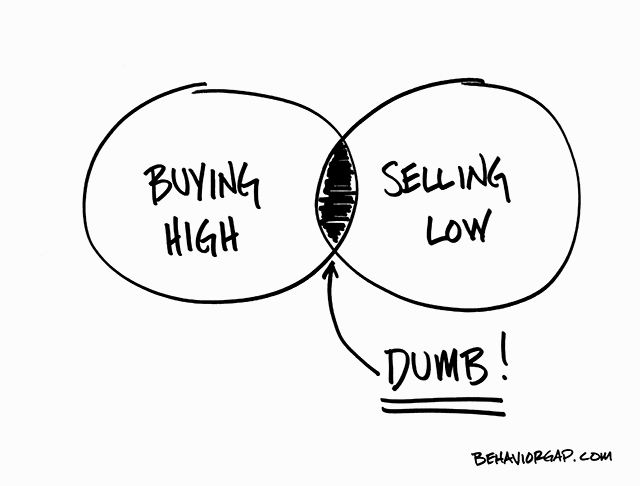
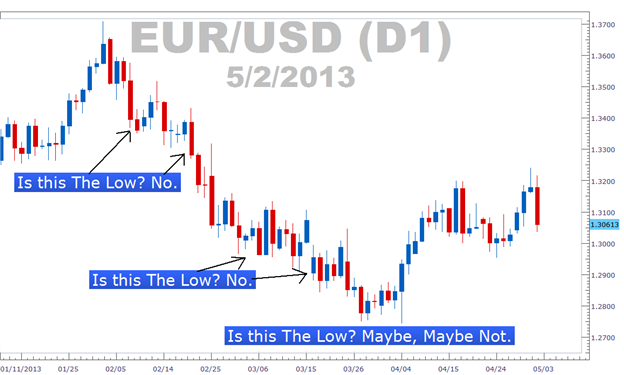
Our methodology is often very difficult for most investors to employ because it calls for purchasing stocks or ETFs after they have made big price gains. The average investor finds this excruciatingly difficult to do. After all, it is contradictory to conventional wisdom, which is to buy low and sell high. This premise certainly seems logical enough but what investors overlook is the fact that a depressed stock is weak for a reason and can remain that way for a long period of time. In contrast, a strong stock has already demonstrated its ability to score big price gains. A stock’s ability to make substantial headway vs. the rest of the market is one of the telltale signs of its potential to be among the big winners of a bullish cycle. Therefore, we like to buy high, but sell higher.
There are times you should not have any exposure to the stock market. Whenever we invest in a new group of stocks or ETFs we have any exit strategy in place. For example, we issued a sell signal to all of our subscribers to move into a 100% cash position on January 17, 2008. The reason we took this action was twofold. There was a breakdown in the high relative strength stocks and ETFs that were leading the market. Second, our real money portfolios violated their predetermined stop loss points.
As you know, over the ensuing months the S&P 500 fell nearly 50% with many buy-and-hold investors getting clobbered to the tune of 50% losses in their portfolios. The last time we moved to an all cash position was back in 2002 when the S&P 500 fell 22%. Using a stop-loss strategy has been a cornerstone of our investment strategy dating back over 40 years with the first publication of The Chartist in 1969.
The proof that you can use risk management techniques to be a successful investor is in our track records. Our publications feature real money accounts. These accounts use relative strength to select which stocks or ETFs to be invested in and more importantly these real money accounts utilize a stop loss strategy to move into cash to protect our capital during difficult market environments.

On a year-over-year basis our Chartist Actual Stock Account is +6.89%, Chartist Mutual Fund/ETF Account +6.78% and the S&P 500 with dividends -20.00%. In 2008 our Stock Account was -10.81%, Mutual Fund/ETF Account -5.36%, S&P 500 w/div. -37.00%. Over the past five calendar years, our Stock Account is +35.33%, Mutual Fund/ETF +44.16% and S&P 500 (with dividends) -10.90%. Over the last eight years (123100 to 123108) the Chartist Stock Account was +21.91%, Mutual Fund/ETF Account +81.67% and the S&P 500 w/div. -21.61%. Both of our real money accounts have outperformed the S&P 500 over the last 20 years. Not only have they outperformed the S&P 500 this was accomplished with about one-third less risk because both portfolios have only averaged being in the market 63% of the time.
In summary, we do not make market predictions or pretend to have a crystal ball. We let the market itself be our guide. When we buy stocks or ETFs we rely on the price action of the market to let us know if we are right or wrong. If we are wrong we simply get out of the market and wait for another buying opportunity. One big winner can erase a host of small losses.
The reason that thousands of intelligent individuals have had poor results in the stock market can be directly attributed to their inability to deploy a very patient, disciplined strategy in which losses are cut short before they become unmanageable. Conversely, when most investors have a winning stock or ETF they are too quick to sell and they are not willing to risk paper profits in the thought of holding a stock or ETF for a spectacular gain. Most investors tend to hold on to their losers and are too quick to sell their winners.
The current advice for both publications is to be in a 100% invested position. In The Chartist we are recommending 25 stocks with an equal weighting for each, and in our mutual fund/ETF letter we are recommending 15 ETFs, also with an equal weighting.
Dan Sullivan is editor of The Chartist newsletter, and Steven Mais is an analyst with Sullivan’s firm in Los Alamitos, Calif.


