Business Financial Analysis Using Ratios
Post on: 16 Март, 2015 No Comment

Analyzing The Financial Statement
Previously, we indicated that financial statements are
prepared so management can make informed,
intelligent decisions affecting the success or failure of
its operations. In the business world, outsiders -
creditors, bankers, lenders, investors and
shareholders — have varying objectives in mind when
they look at a company’s statements. The type of
analysis and the amount of time spent on it depends
upon the objectives of the analyst. An investor
interested in a publicly owned company might spend
less effort than a banker considering a loan
application. A supplier considering an order from a
small business might spend less time and effort than
the banker. The degree of information available on a
business varies according to the requirements of the
business under review. For example, a banker
considering a sizable loan application would normally
require not only a detailed statement of condition and
income for several years, but inventory breakdowns
and aging schedules of receivables, accounts
payable, sales plans and profitability projections.
When a banker, credit manager or investor receives
the financial information desired, an analysis is started
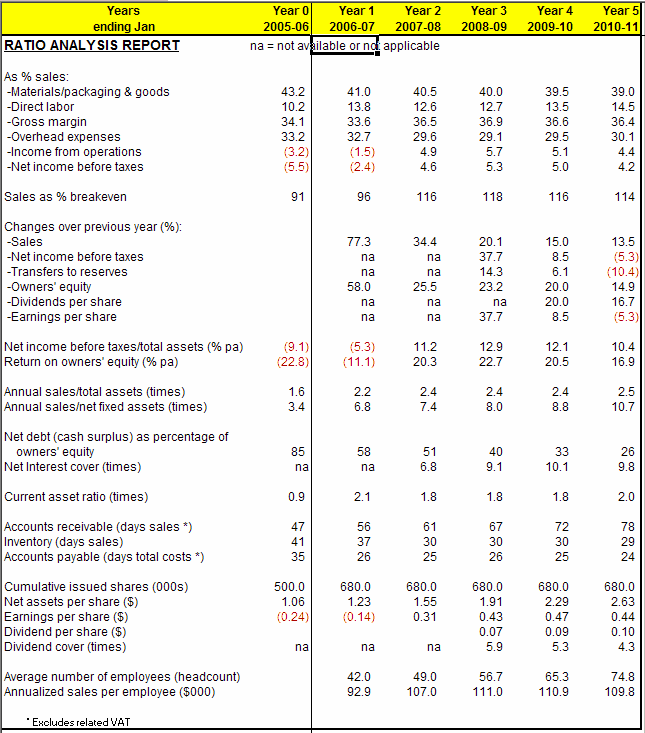
and the leading tool most analysts use is ratio analysis.
Ratios are a means of highlighting relationships
between financial statement items. There are literally
dozens of ratios which can be complied on any
business. Generally, ratios are used in two ways: for
internal analysis of items in a balance sheet; and/or
for comparative analysis of a company’s ratios at
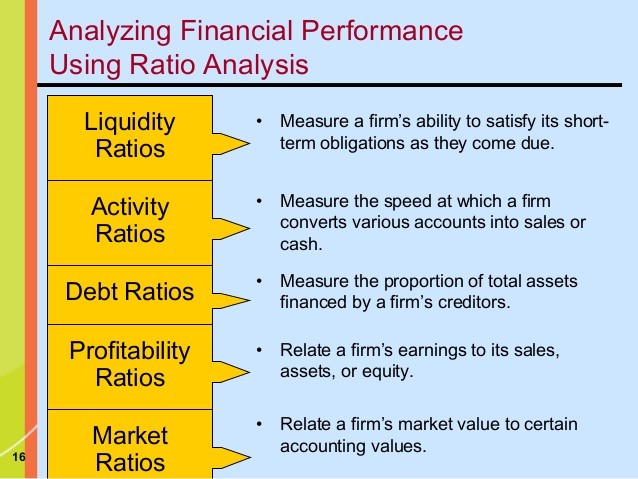
Profitability Ratios — used to measure how well a
company performs.
Solvency Ratios — Quick Ratio
The quick ratio, sometimes called the acid test or
liquid ratio measures the extent to which a business
can cover its current liabilities with those current
assets readily convertible to cash. Only cash and
accounts receivable would be included, as inventory
and other current assets would require time and effort
to convert into cash. A minimum ratio of 1.0 to 1.0 ($1
of cash receivables to $1 current liabilities) is
desirable.
Solvency Ratios — Current Ratio
The current ratio expresses the working capital
relationship of current assets to cover current
liabilities. A rule of thumb is that at least 2 to 1 is
considered a sign of sound financial strength.
However, much depends on the standards of the
specific industry you are reviewing.
Solvency Ratios — Current Liabilities to Net Worth
Current liabilities to net worth ratio indicates the
amount due creditor within a year as percentage of
the owners or stockholders investment. The smaller
Solvency Ratios — Current Liabilities to Inventory
Current liabilities to inventory ratio shows you, as a
percentage, the reliance on available inventory for
payment of debt (how much a company relies on funds
from disposal of unsold inventories to meet its current
debt).
Solvency Ratios — Total Liabilities to Net Worth
Total liabilities to net worth shows how all of the
company’s debt relates to the equity of the owners or
stockholders. The higher this ratio, the less protection
there is for the creditors of the business.
Solvency Ratios- Fixed Assets to Net Worth
Fixed assets to net worth ratio shows the percentage
of assets centered in fixed assets compared to total
equity. Generally the higher this percentage is over 75
percent, the more vulnerable a concern becomes to
unexpected hazards and business climate changes.
Capital is frozen in the form of machinery and the
margin for operating funds becomes too narrow for
day to day operations.
Efficiency Ratios — Collection Period
Collection period ratio is helpful in analyzing the
collectability of accounts receivable, or how fast a
business can increase its cash supply. Although
businesses establish credit terms, they are not always
observed by their customers for one reason or
another. In analyzing a business, you must know the
credit terms it offers before determining the quality of
its receivables. While each industry has its own
average collection period (number of days it takes to
collect payments from customers), there are observers

who feel that more than 10 to 15 days over terms
should be of concern.
Efficiency Ratios — Sales to Inventory
Sales to inventory ratio provides a yardstick for
comparing stock-to-sales ratios of a business with
others in the same industry. When this ratio is high, it
may indicate a situation where sales are being lost
because a concern is understocked and/ or customers
are buying else where. If the ratio is too low, this may
show that inventories are obsolete or stagnant.
Efficiency Ratios — Assets to Sales
Assets to sales ratio measures the percentage of
investment in assets that is required to generate the
current annual sales level. If the percentage is
abnormally high, it indicates that a business is not
being aggressive enough in its sales efforts, or that its
assets are not being fully utilized. A low ratio may
indicate a business is selling more than can be safely
covered by its assets.
Efficiency Ratios — Sales to Net Working Capital
Sales to net working capital ratio measures the
number of times working capital turns over annually in
relation to net sales. A high turn over can indicate
over trading (an excessive sales volume in relation to
the investment in the business). This ratio should be
reviewed in conjunction with the assets to sales ratio.
A high turnover rate might also indicate that the
business relies extensively upon credit granted by
suppliers or the bank as a substitute for an adequate
margin of operating funds.
Efficiency Ratios — Accounts Payable to Sales
Accounts payable to sales ratio measure how the
company pay its suppliers in relation to the sales
volume being transacted. A low percentage would
indicate a healthy ratio.
Profitability Ratios — Return on Sales (Profit
Margin)
Return on sales (profit margin) ratio measures the
profits after taxes on the year’s sales. The higher this
ratio, the better the prepared the business is to handle
downtrends brought on by adverse conditions.
Profit Ratios — Return on Assets
Return on assets ratio is the key indicator of the


