Analysis of Financial Statements
Post on: 18 Август, 2015 No Comment

Analysis of Financial Statements
Chapter 22 Lecture Notes
Financial statement analysis is the examination of both the relationships among financial statement numbers and the trends in these numbers over time. It uses the past performance of a company to predict its future profitability and cash flows and evaluates its performance in order to identify problem areas.
To be meaningful information needs to be compared to some benchmark. Comparison with values from previous years is one such. The SEC requires as a minimum reporting of three years’ reporting for income and cash flow statements and two years’ for balance sheets. Comparison with other firms in the same industry offers another benchmark. These can be obtained from the COMPUSTAT database and from Value Line and Dun & Bradstreet.
Comparisons between financial statements are most informative, according to the Accounting Principles Board, when the presentations are arranged identically within the statements, when the same items form the underlying accounting records are similarly classified, when the financial effects of any accounting principle changes are disclosed, and when changes in circumstances or in the nature of the underlying transactions are disclosed.
The use of common-size financial statements enhances comparability of information. This means showing all amounts for a given year as a percentage of sales for the year; it applies to both year-by-year and industry-average comparisons, and to both income statements and to balance sheets.
The DuPont Framework (page 1274) provides a systematic approach to identifying general factors causing return on equity (net income / equity or ROE) to deviate from normal, and for more in-depth analysis of a company’s areas of strength and weakness. ROE consistently below 15% is a sign of trouble. ROE can be decomposed into three components:
Return on Equity = Profitability x Efficiency x Leverage
= Return on Sales x Asset Turnover x Assets-to-Equity-Ratio
= Net Income x Sales x Assets
Sales Assets Equity
Besides the DuPont Framework, many other rations are useful. Some examples follow.
Profitability Ratios: when Return on Sales indicates a profitability problem, common-size income statement ratios can help detect which expenses contribute most to profitability problems.
Efficiency Ratios: the asset turnover ratios taken from common-size balance sheets indicate which assets cause inefficiency in the generation of sales revenue. The Accounts receivable turnover ratio, the inventory turnover ratio, and the fixed asset turnover ratio indicate whether a firm is holding too much or too little of a particular asset. Turnover ratios can also be expressed in terms of the amount of time the asset is held on the average, as with the Average collection period and the Number of days’ sales in inventory.
Other measures of efficiency in the use of resources are average weekly sales per store and annual sales per square foot of store space.
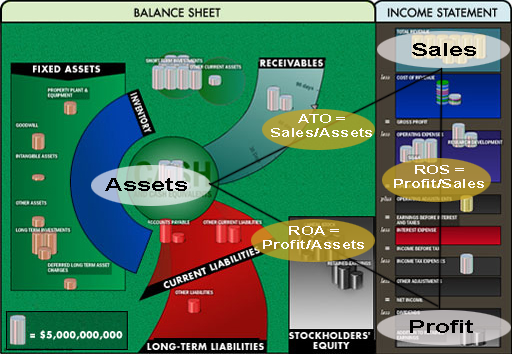
Return on assets is determined by combining profitability and efficiency:
Return on assets = net income / total assets = Return on Sales x Asset Turnover
The profitability of each dollar in sales is sometimes called a company’s margin. The degree to which assets are used to generate sales is called turnover. In some industries margin is high but turnover is low (supermarkets); in others, the reverse is true (jewelry stores). Either pattern can generate good profits: what matters is the combination of the two,
Leverage ratios: these indicate how well the company is using other people’s money to purchase assets. Leverage is borrowing so that a company can purchase more assets than the stockholders can pay for through their own investment. Higher leverage increases return on equity through purchasing more assets without additional equity investment; the additional assets generate more sales, which should mean more net income. Investors prefer high leverage (so as to avoid diluting their equity); creditors want low leverage (for greater safety for their loans). Two common leverage ratios are debt ratio and debt-to-equity ratio. The important thing is to use comparable ratios.
Number of times interest earned is a ratio measuring the debt position of a company in relation to its earnings ability:
Number of times interest earned = income before charges for interest or income tax
Interest requirement for the period
Liquidity ratios: these measure the ability to meet current obligations. The current ratio is total current assets / total current liabilities. A more direct measure in the cash flow adequacy ratio. cash flow from operating activities / total primary cash requirements, which is the sum of dividend payments, long-term asset purchases, and long-term debt repayments.
Earnings per share (EPS) is also a financial ratio, treated extensively in chapter 18.
Dividend payout ratio is dividends divided by net income, an indicator of a firm’s dividend policy. High-growth firms have low ratios, low-growth stable firms high ones.
Price-earnings ratio (P/E ratio) indicates how attractive the market values the stock as an investment. It equals market price per share of stock divided by the EPS.
Investment analysis make frequent use of the book-to-market ratio. which reflects the difference between a company’s balance sheet value and its actual market value. A high value may indicate that the market is currently undervaluing a company.


