Airline Stock Metrics for Investors
Post on: 31 Март, 2015 No Comment

There are several metrics unique to the Air Transport industry that may be utilized to evaluate airline stocks. Some of these, including Load Factor and Gross Equipment per share can be found on the Value Line page. The industry can also be broken down into two subsets. Large, traditional (legacy) carriers operate through a hub-and-spoke system, whereby many flights go through one of their main hubs dispersed throughout the United States Smaller players may utilize a point-to-point system, serving leisure destinations from smaller airports.
Factors to Consider
Airfares fluctuate according to the seating supply/demand balance and are generally similar across competitors. The average fare is also affected by the mix of business to leisure passengers. This metric rises during healthy economic periods, but in a weak climate travelers are apt to trade down to less expensive seating, thus restraining pricing. Along those lines, excess seating capacity (measured in available-seat-miles) can force airlines to discount ticket prices. “Load Factor” is a figure included in the array of most Value Line Air Transport company reports. This is a measure of aircraft occupancy, indicating the carrier’s efficiency in adjusting capacity to meet demand. Due to the seasonality of air travel, load factors are typically higher, and airlines’ bottom lines better, in the second and third quarters. On that note, “Gross Equipment per share” can also be found in the array. Aircraft purchases will lift this figure, though carriers also reduce the amount to boost efficiency.
In March, 2008, the U.S./EU open skies agreement became effective, allowing carriers to operate between any two points in the two regions.This deregulation has facilitated the expansion by airlines into foreign markets and enhanced competition on transatlantic routes.
Cyclical Influences
Air carriers’ prospects are closely tied to the domestic and global economies, which effects demand for business and leisure air travel. Results can hinge partly on the particular geographical markets serviced; one may have more exposure to the East Coast, West Coast, TransAtlantic, or Pacific regions. Oil prices are another important factor, as fuel is currently the industry’s biggest cost. When these two variables are favorable, profits can be sizable; however during an economic slump, or when oil prices have skyrocket, carriers tend to post losses.
In the airlines’ favor, over the past decade an increasingly-globalized economy has boosted the need for international air travel, providing new avenues for growth. Carriers have bulked up their overseas presences and realized improved pricing in growing markets.
Generally, revenues from ticket sales rise and fall with air traffic (revenue passenger miles). The airlines also derive a small portion of revenue, 3%-4% of the total, from cargo transport, and another modest amount from other items, such as bag checking and flight change fees. Carriers can aggressively increase these ancillary charges as a means of offsetting the impact of elevated fuel costs and other negative trends. Margins are hard to predict and depend on the carrier’s cost structure. After fuel, labor is the largest cost outlay. Strong unions often set wage rates and scheduling rules that may be incongruent with the current operating climate. In response, carriers can take cost-cutting and revenue-boosting steps, such as tacking fuel surcharges onto fares, hedging fuel prices, and furloughing employees to some extent.
Competitive Atmosphere

The domestic airline industry is relatively concentrated, due to the large capital investment necessary to launch a new company. But, it is also increasingly characterized by rising competition from smaller point-to-point carriers that are able to undercut the average airfare. On major routes, there may be several other competing airlines, possibly departing from different airports, and pricing competition has become fierce. Additionally, on foreign routes, competition from local carriers can constrain revenue yields (revenues-per-available-seat-mile).
Rising competition and the growing need by travelers to reach multiple destinations has encouraged the formation of global alliances, of which currently there exist three major ones. These groupings of carriers allow airlines to retain their market shares by offering access to markets not served directly. Furthermore, the desire for horizontal integration increases when conditions sour. For example, last year two of the five largest U.S. airlines merged, creating the biggest industry participant.
Risks and Rewards
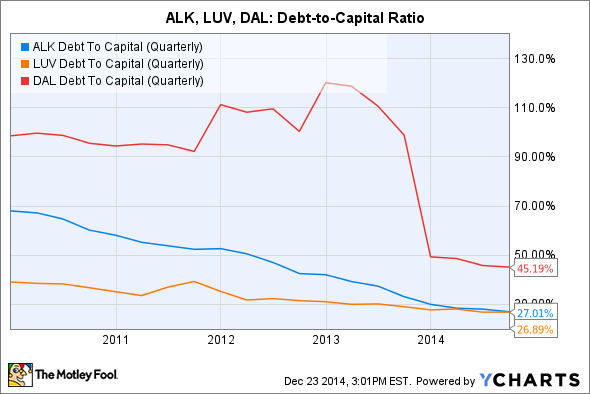
Those considering Air Transport stocks should be wary of the significant risks that accompany them. Foremost, their earnings profiles are volatile and usually highly unpredictable. As such, we recommend examining an airline’s Earnings Predictability score as well as its Safety rank. Given that they often also have sizable capital spending requirements, cash levels may decline precipitously, especially during the seasonably slow December and March quarters. Accordingly, most airlines often issue new shares, carry a sizable debt balance, and may be at risk of credit defaults if conditions worsen severely. For that reason, we advise reviewing each carrier’s long-term debt-to-capital ratio.
Air Transport stocks’ performances generally mirror the broader market, but can also move sharply on oil price changes. They typically trade at low P/E ratios, and, depending on the airline, stock prices may rise more than the market average when operating conditions improve or oil prices drop.
At the time of this article’s writing, the author did not have positions in any of the companies mentioned.


