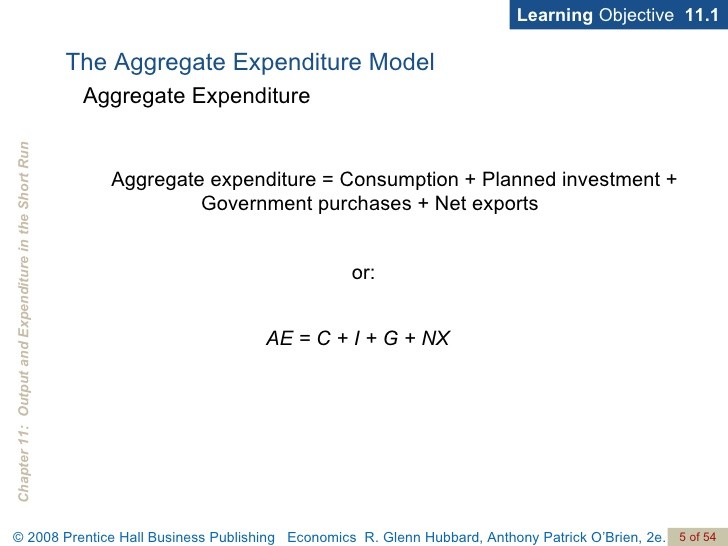
Aggregate Expenditure Consumption Investment Government Purchases and Net Exports
Post on: 23 Июнь, 2015 No Comment

Disposable Income — Income actually available for spending is personal income less net taxes. The difference between disposable income and consumption is savings.
- Consumer spending and disposable income move together over time. Consumer spending and disposable income increased nearly every year. The relationship between consumer spending and disposable income has remained relatively stable
*In the 90s, we have spent about 92 percent of our disposable income, and saved about 8 percent. More recently consumers have in some months increased consumption faster than income resulting in a negative savings rate (higher debt accumulations).
The Consumption Function — The relationship between the level of income in an economy and the amount households plan to spend on consumption, other things constant.
Households look at their level of disposable income and decide how much to spend. So spending depends on disposable income.
- The relationship between consumption spending and disposable income is captured by the slope of the consumption function. The influences of other factors that are independent of income are captured by the intercept.
B. Marginal Propensity to Consume and Save
Economists use marginal analysis to the relationship between changes in disposable income and changes in consumption.
Marginal analysis seeks to answer questions like, If U.S. households receive another billion dollars in disposable income, what will happen to consumption spending, what about savings?
- MPC = change in consumption divided by the change in disposable income MPS = change in consumption divided by the change in disposable income Since disposable income is either saved or consumer: MPC + MPS = 1
C. MPC, MPS, and the Slope of the Consumption and Saving Functions
The slope of the consumption function is the MPC. Because the slope of a line constant everywhere along the line, the MPC for any linear consumption function will be constant at all levels of income.
The slope of the saving function equals the MPS. It is also a positive fraction that represents a leakage rate from increases in household income in the circular flow of income. Because the slope of a line is the same everywhere on that line, the MPS for any linear savings function is constant for all levels of income.
D. Non-income (Autonomous) Determinants of Consumption
Along the consumption function, consumption spending depends on the level of disposable income, other things constant. What factors are held constant, and how do they affect Consumption?
- Net Wealth and Consumption
Net Wealth — The value of a household’s assets minus its liabilities (debts owed).
(Assets — home, cars, furniture, savings accounts, checking accounts; Liabilities — student loans, car loans, mortgage, credit card balances)

Household wealth is assumed constant along a consumption function.
- An increase in net wealth makes a household more likely to spend and less likely to save at each level of disposable income. A decrease in net wealth makes a household less likely to spend and more likely to save at each level of disposable income.
**Example, a fall in stock prices. What happens to net wealth if the value of stock declines? It falls. Households that own stock have a decrease in net wealth and are likely to spend less and save more. The consumption function shifts down.
- The Price Level
Some household wealth is held in dollar-denominated assets (bank accounts, cash).
When the price level changes, so does the real value of dollar-denominated assets. A falling price level increases the real value of dollar-denominated assets, thereby encouraging greater consumption for goods and services. A higher price level discourages consumption demand as it lowers the real value of the dollar.
- The Interest Rate
Consumers make inter temporal decisions to consumer (or save) over their lifetime. Interest is the reward to savers for current saving. When graphing the consumption function, we assume a given interest rate.
If the current interest rate increases, savers will save more, borrow less, and spend less because it increases the opportunity cost of consumption. This, in turn causes the consumption function to shift downward. Lower current interest rates increase consumption and lower savings.
- Expectations
Example: If people grow more concerned about job security and future expected income, they will reduce their consumption spending at all levels of disposable income. An expected tax cut that is viewed as permanent could increase current consumption.
Expectations about future prices can also affect current consumption. Higher expected prices for real assets can increase current consumption. Higher expected prices of financial assets can lower consumption. (Remember that “investing” in financial assets is savings.)
Exercises:
Read “Getting Started: Japan’s Plea to Consumers” on page 267 and answer question 3 on page 287.)


