ADX Average Directional Index
Post on: 8 Апрель, 2015 No Comment

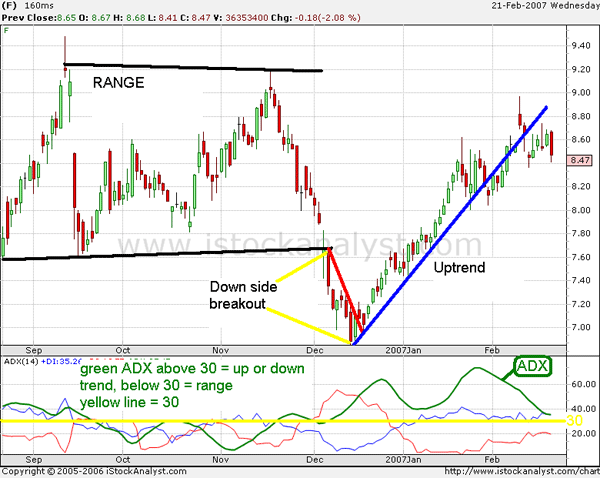
Developed by Welles Wilder The Average Directional Index or ADX for short, is used to identify and measure trends. The ADX is used in conjunction with the Minus Directional Indicator (-DI) and Plus Directional Indicator (+DI).
Although Wilder designed ADX with commodities and daily prices in mind, these indicators work quite well with stocks.
The ADX measures the strength of the trend, while the DI- & DI+ tell us the direction of the trend.
What we are looking for most of the time is the start of a positive trend, so we would like to see a rising ADX line coupled with a DI+ cross over the DI-. When the DI+ line is also over the ADX line, this is also a good sign.
Plus Directional Movement (+DM) and Minus Directional Movement (-DM) form the backbone of the ADX. Wilder determined directional movement by comparing the difference between two consecutive lows with the difference between the highs.
Directional movement is positive when the current high minus the prior high is greater than the prior low minus the current low. The Plus Directional Movement (+DM) then equals the current high minus the prior high, provided it is positive. A negative values show as zero.
Directional movement is negative when the prior low minus the current low is greater than the current high minus the prior high. The Minus Directional Movement (-DM) equals the prior low minus the current low, provided it is positive. A negative values show as zero.
This indicator works quite well when trading currencies, as it’s designer, Wilder was a currency trader as well as a commodity trader.
Remember, as with most other indicators, you can change the default values to better suit the stock you are planning to trade.
Do this by looking at the stock’s trading history and seeing what parameters match best. This will require some trial and error, but over time you will learn to easily match indicators to stocks based on the particular stock’s normal trading behavior.
As I said earlier, the ADX is used to measure trends. Wilder suggests when ADX is above 25 a strong trend is present and no trend is present when below 20. Between 20 and 25 is considered a grey area. As noted above, traders may need to adjust the settings to increase sensitivity and signals. The downside to the ADX is the amount of lag, because of all the smoothing techniques. Many technical analysts use 20 as the key level for ADX.
As with all other indicators, don’t just rely on the defaults, adjust your indicators to suit the stock you are looking at and your trading style.
Typically shorter look backs (lower #’s on your indicators) give you quicker signals which is good for aggressive traders, while longer look backs (higher #’s on your indicators) give slower but more reliable signals for traders who are more conservative.
As we always say: Don’t use your hard earned cash to find out what kind of trader you are, use a virtual account for that.
Links for free virtual trading sites can be found on our Resources page:
Take Me To Resources
The ADX is calculated using the following formula:
First calculate the True Range (TR), Plus Directional Movement (+DM) and Minus Directional Movement (-DM) for each period.
Then Smooth the TR (First TR14 = Sum of first 14 periods of TR1
Second TR14 = First TR14 — (First TR14/14) + Current TR1
Subsequent Values = Prior TR14 — (Prior TR14/14) + Current TR14)
Divide the 14-day smoothed Plus Directional Movement (+DM) by the 14-day smoothed TR to find the 14-day DI+ (+DI14). Multiply by 100 to move the decimal point two places. +DI14 is the green line plotted along with ADX.
Divide the 14-day smoothed Minus Directional Movement (-DM) by the 14-day smoothed TR to find the -DI14. X 100 to move the decimal point two places. -DI14 is the red line plotted along with ADX.
The Directional Movement Index (DX) = the absolute value of +DI14 less — DI14 divided by the sum of +DI14 and — DI14.
To Calculate the ADX line. The first ADX value is a 14-day average of DX. Subsequent ADX values are smoothed by multiplying the previous 14-day ADX value by 13, adding the most recent DX value and dividing this total by 14.


