A Triple Play Income Strategy
Post on: 16 Март, 2015 No Comment

There are some compelling reasons to want to invest for income.
For one thing, such a strategy regularly throws off cash. Obviously, this adds a risk-aversion flavor to your portfolio. Instead of hoping for good capital gains in the future, you can get some, perhaps even most, or your returns up front and according to a schedule that while not iron clad (companies can reduce or eliminate payouts if need be, as when business deteriorates badly) is a heck of a lot more visible than is usually the case for buy-low sell-high equity strategies.
Also, did you ever get a sense that companies that have high-yielding shares are somehow different in terms of corporate personality compared with others? Its not your imagination. There is something to this.
Consider the basic choice you always make between reinvesting dividends back into your portfolio or spending the money elsewhere. Thats equivalent to the choice corporate executives make between giving profit to shareholders and letting them decide for themselves what to do with the money, versus managers forcing the issue by choosing to reinvest in the corporation rather than paying dividends.
Consider, now, the kind of management that would pass such decisions on to shareholders. This doesnt come from altruism. Instead, it comes from a recognition that the companys growth prospects arent that great and that shareholders would often be better off getting money and deciding for themselves what to do with it. I dont usually like to get moralistic when discussing stock or company analysis, but it is hard to avoid giving managers of income-play corporations at least some sort of favorable nod. There are plenty of companies that lack good growth prospects but are burdened with mangers that have unrealistic attitudes in this regard and often wind up squandering corporate resources on bad business ventures or acquisitions.
Shareholder governance aside, this leads us to a very important decision point for all income investors; one that lies at the core of this triple-play income strategy. Its the distinction between yield versus growth. Higher yields tend to be associated with lesser growth prospects. This isnt just a textbook thing. Its very much real.
Figure 1 shows back-tested performance, from 3/31/10 through 1/31/10, of a simple StockScreen123.com screen that searched for stocks yielding at least 10%. (It also eliminated ADRs, close-end funds, and stocks that trade OTC, have market capitalizations below $250 million and prices below $5. The back-test assumes the screen was refreshed once every three months.)
click to enlarge images
Figure 1
That amounted to an average annualized loss of 5.6%.
Figure 2, on the other hand, shows the back-tested performance after the screen was revised to seek yields between 2% and 5%.
Figure 2
That worked out to a gain of about 5.8% per year.
So be careful about being a yield hog. That approach is risky. for real!
Still, I cant fully bash a quest for yield. There are a lot of yield-oriented investors that really do need to do better than, say, 2%-3%. For one thing, higher yield produces opportunities to reinvest and earn interest on interest, so to speak. Hence Figure 1 is a bit understated. And assuming we dont reach so high as to take on to much dividend-security risk (dividend cuts in response to bad business trends), stocks and funds that have higher yields are often less volatile (because a bigger percent of the overall return is realized up front when dividends are paid, thereby diminishing the portion of return that is subject to the usual company and market risks).
The triple-play strategy addresses three aspects of the income-producing universe: (i) stocks that feature lower yields but may have greater potential for dividend growth; (ii) stocks with better, but still not sky-high, yields that assume much less in the way of potential dividend growth, and (iii) a pure reach for higher yield, which I implement by choosing a junk-bond ETF. Details of the strategies and back-tested performance data can be found in the Appendix below.
I started trading the strategy in my FolioInvesting.com brokerage account on 10/26/10.
Figure 3 shows the performance record.
Figure 3
At first glance, that seems unimpressive. Bear in mind though that the S&P 500 benefited from a nice rally for most of the period. Income investors dont usually try to chase moves like those.
Note that the Triple Play total return for the three-month period was 3.38%. Id love to keep that going. If I compound it over the course of a year, four quarter, that would work out to an annual return of 14.2%. Im not saying its going to happen. But what income investor wouldnt be thrilled it things were to work out that way.
A better here-and-now comparison would be the one seen in Figure 4, which compares the portfolio to the Dow Jones Corporate Bond Index.
Figure 4
When I rebalanced this week, I aimed to put 25% in the growth-oriented strategy, 25% in the equity-yield strategy, and 50% in the junk-bond ETF. But since only nine stocks (out of a desired 15) made it into the growth screen, I decided to divert the excess to the junk bond ETF. So the allocations I went with were 15%, 25% and 60% for growth, equity yield, and junk bonds respectively.
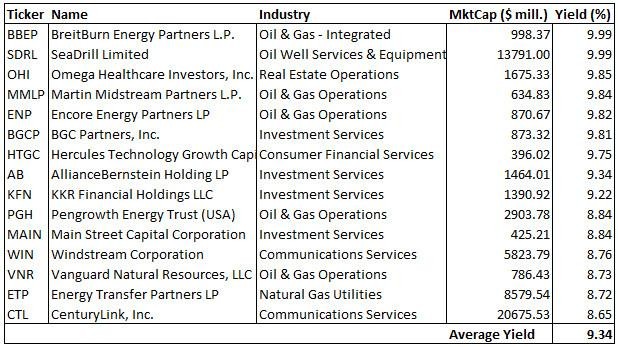
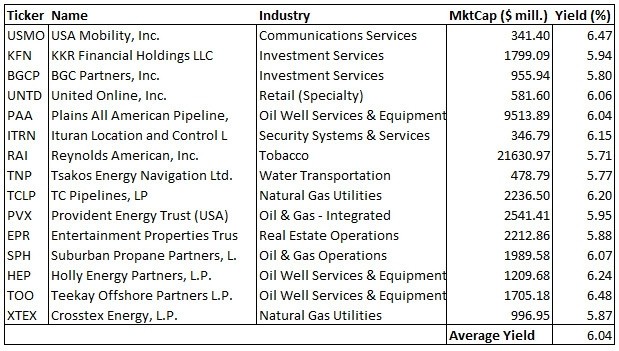
The holdings are as follows:
Table 1
This is one of those times when we really do need to take note of the by-now-standard warning investors typically see telling them that past performance is no assurance of future outcomes. Usually, those words are intended to pour cold water on undue enthusiasm over strong historical results and suggesting the future wont likely be so good. Here, we may be looking at the flip side of this. The last five years included the financial crisis and recession in its entirety. As noted above, higher-yielding stocks tend to be those most prone to dividend cuts. We did, indeed, see plenty of that in the past in Strategy 2. Assuming the economy remains at least reasonably healthy going forward, we can probably expect more tolerable dividend growth numbers; zero to one percent would be OK for this strategy.
Because I trade on FolioInvesting.com. commissions are irrelevant. (I pay a flat annual fee for unlimited trading during the firms two daily trading windows.) But even for others, trading costs may be reasonable considering we rebalance only once every three months. If you want to implement a strategy like this and need to trim commissions, you might consider eliminating Strategy Two and giving a higher weight to Strategy One.
APPENDIX
The Tilting Toward Dividend Growth model begins with a screen that’s built as follows:

- Basic liquidity rules: OTC stocks are barred, market capitalization is at least $250 million, and share price is at least 5
- Eliminate companies classified in the Miscellaneous Financial Services Industry, most of which are investment companies and funds and not the kind of stocks sought by most users
- Eliminate ADRs
- Stock yield is at least 50% of yield on 10-year Treasury (stocks are expected to yield less than Treasuries since dividends grow, while Treasu ry interest payments do not)
- Stock yield plus 5-year dividend growth rate is at least 50% above yield on 10-year Treasury
- 5-year dividend growth rate is at least 10% above the industry average
- Trailing 12 month payout ratio can be up to 25% above industry average
- 5-year capital spending growth rate is positive at least 90% of industry average (suggests pent-up capital spending needs are not likely to compete heavily with dividend payments)
- Current yield relative to industry average is no higher than 10% above the five-year average relative yield (a test that shows no special market concern regarding the safety of the dividend)
From the stocks that pass the screen, we select the top 15 based on the StcokScreen123 QVG Ranking system, which has three components:
- Quality (return on capital, margin, turnover and financial strength)
- Value (price-earnings, price-sales, price-cash flow, and price-book)
- Growth (long- and short-term sales and EPS growth and acceleration)
If, at any point, fewer than 15 stocks pass the screen, we assume that portion of the portfolio is allocated to cash. In other words, no stock ever starts a three-month period with a stake higher than 6.7%.
Figure A-1 shows the price-only performance record of the screen assuming that the model is refreshed and the list reconstituted every three months.
Figure A-1
This particular strategy, like so many, got hammered during the 2007-08 financial crisis. Im assuming we wont repeat that scenario going forward and that market conditions are more likely to resemble those we experienced in 2004-06, when the strategy performed quite well.
The Tilting Toward Current Yield model begins with a screen that’s built as follows:
- Basic liquidity rules: OTC stocks are barred, market capitalization is at least $250 million, and share price is at least 5
- Eliminate companies classified in the Miscellaneous Financial Services Industry, most of which are investment companies and funds and not the kind of stocks sought by most users
- Eliminate ADRs
- Stock yield is at least 150% of yield on 10-year Treasury
- Current yield relative to industry average is no higher than twice the five-year average relative yield (allows for some measure of market concern regarding safety of dividend so long as its not exorbitant)
From the stocks that pass the screen, we select the top 15 based on the StcokScreen123 QVG Ranking system, which has three components:
- Quality (return on capital, margin, turnover and financial strength)
- Value (price-earnings, price-sales, price-cash flow, and price-book)
- Growth (long- and short-term sales and EPS growth and acceleration)
If, at any point, fewer than 15 stocks pass the screen, we assume that portion of the portfolio is allocated to cash. In other words, no stock ever starts a three-month period with a stake higher than 6.7%.
Figure A-2 shows the price-only performance record of the screen assuming that the model is refreshed and the list reconstituted every three months.
Figure A-2
The All Yield All The Way Model selects the top rated domestic junk-bond ETF based on the following factors:
Figure A-3 shows the price-only performance record of the screen assuming that the model is refreshed and the list reconstituted every three months.


