A Better Global Asset Allocation Strategy
Post on: 25 Июль, 2015 No Comment

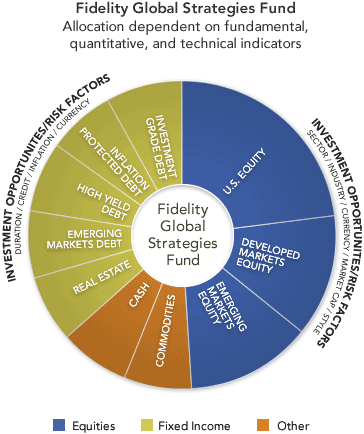
A global asset allocation strategy attempts to take advantage of relative strength and momentum within global markets. Typically asset classes are used via ETFs or mutual funds instead of individual securities, as the latter may have higher overall transaction costs.
Since most of these strategies focus on quantitative methodologies, they tend to have shorter holding periods when compared with a portfolio holding individual equities. As a result, positions are typically held less than a year and can rotate between various asset classes such as equities, fixed income, currency, etc.
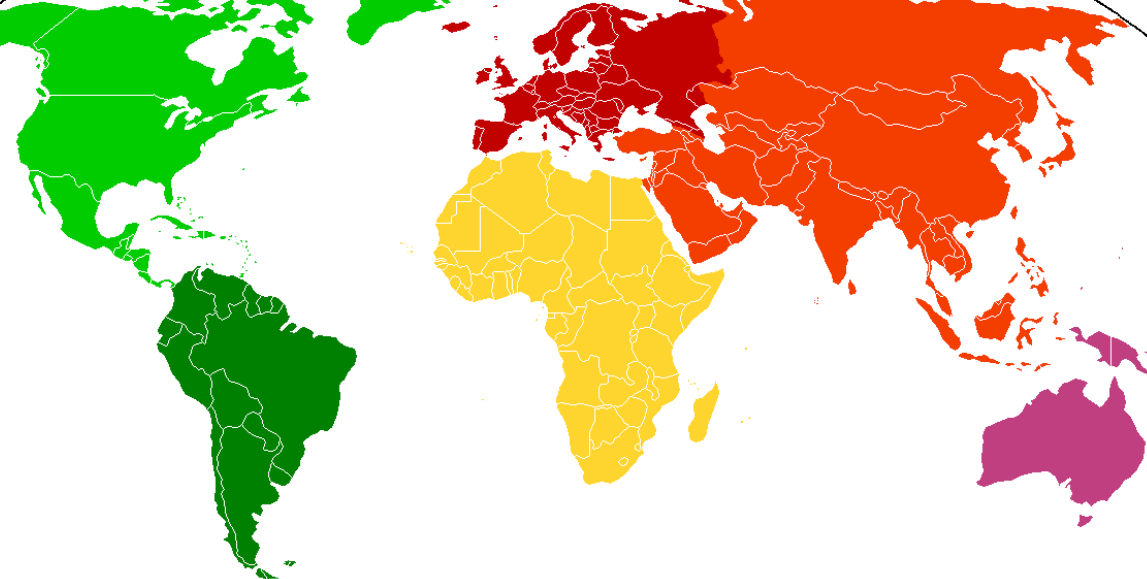
The objective is to provide investors with the opportunity to invest in economies around the world both major and emerging while providing a risk-based approach in order to reduce exposure to volatile economies during uncertain times.
Active Management vs Buy and Hold?
The first question I usually hear from investors is: why we dont just buy and hold instead of using a global asset allocation strategy? The truth is, informed portfolio managers have had much more success using a systematic-based approach instead of the set it and forget it attitude of the 1990s.
The last secular bear market that US investors faced occurred in 1968 and lasted until 1982. During that time, buy and hold investors saw a great deal of market volatility, but received little in return for their patience.
The National Association of Active Investment Managers (NAAIM) did a study on the time period from January 1984 to December 2008 to show the difference in performance that active investment management can have over a buy and hold strategy. The study found that if you missed the 10 best and 10 worst days in the market, the resulting return would have been 8.15%, as compared to the 7.06% S&P 500 Index return:
So how does an investor miss the worst days?
In his 2006 book, Stocks for the Long Run, Jeremy Siegal studied the Dow Jones Industrial Average (DJIA) from 1886 to 2006 and found that the 200 day moving average provided a way for investors to reduce volatility in their portfolios and increase returns by avoiding stocks when they trade below the 200 day moving average.
More recently, Mebane Fabers book The Ivy Portfolio studies the use of moving averages and found similar results using a 10 month moving average:
Additionally, this strategy was able to avoid most of the 2008 stock market decline:
Timing + Relative Strength + Allocation
By comparing relative strength among globals ETFs, we can figure out the 10 strongest performing ETFs (done on a monthly basis). The 10 ETFs are allocated equal weight within our global asset allocation strategy, then overlayed with the 10 month moving average.
The ETF universe that I used is prescreened for liquidity, trading volume, overlap, and bid/ask spreads and is as follows:
If the ETF is trading below the 10 month moving average, then it is replaced with iShares Barclays 20+ Yr Treasury Bond ETF (TLT) or similar ETF. The reason the country specific ETF is replaced with TLT is that as equity markets in overseas countries start to decline, assets tend to move to one of two places: stronger performing countries or safe haven assets.
Currently, US Treasury Bonds are considered by many to be the safest asset class in the world. In fact, this model allows 100% of the portfolio to be invested in TLT in cases of global shock, as in 2008.
This process is continued and rebalanced monthly.
Results For The Global Asset Allocation Strategy


To compare results of our strategy, I took the above criteria and backtested the results using ETFreplay.com (which is a fantastic site that allows investors to research and backtest different ETF strategies). During this time frame, the model outperformed the S&P 500 with less overall volatility:
Relative Strength + 10 Month Moving Average
Conclusion
Investors are able to reduce volatility and drawdowns by investing in a US Treasury Bonds ETF (TLT), as global economies trend downward below their respective 10 month moving average.
By combining relative strength with a 10 month moving average, investors can create a more tactical investment strategy which has outperformed the S&P 500 Index during the past 10 years.
Data:
For those interested, here are links to the buy/sells for the above strategies. I used ETFreplay to produce the backtested graphs.
Global Asset Allocation Strategy Data:
Note: I am including the data using the non relative strength/moving average model, but instead of cash, the model moves into TLT. The backtested performance is better, however I didnt include it above, since the higher levels of trading may be a bit complex and costly for non-institutional investors.


