10 Online Marketing Metrics You Need To Be Measuring
Post on: 16 Март, 2015 No Comment

Follow Comments Following Comments Unfollow Comments
Measurement is what makes marketing a science, rather than a superstition. For many business owners, marketing is a superfluous expense—something to spend money on only when the budget is flexible enough to accommodate it. This is because the return on investment on marketing is, in many cases, unpredictable. Your ad could be a resounding hit, flooding you with thousands of new interested customers, or it could be a seeming dud, wasting your time and money.
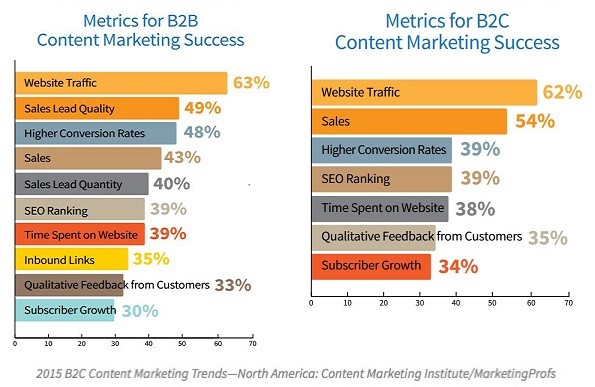
Solid metrics give you the insight to overcome this hurdle of unpredictability. If you’re just starting out or you need to overhaul your existing marketing strategy, make sure to familiarize yourself with these 10 marketing metrics:
1. Total Visits. Your main website should be a primary target for your customers and potential customers, but you can also measure total visits to any location relevant to your strategy, such as a landing page for a pay-per-click campaign. Measuring your total number of visits will give you a “big picture” idea of how well your campaign is driving traffic. If you notice your numbers drop from one month to the next, you’ll know to investigate one of your marketing channels to figure out why. In a healthy, steady campaign, you should expect your total number of visits to grow steadily.
2. New Sessions. A metric found in Google Analytics, the total number of new sessions will tell you how many of your site visitors are new and how many are recurring. It’s a good metric to understand because it tells you whether your site is sticky enough to encourage repeat customers as well as how effective your outreach efforts are. For example, if you change the structure or content of your site significantly and your ratio of recurring visitors to new visitors drops, it could be an indication that your website is losing effectiveness in warranting multiple visits.
3. Channel-Specific Traffic. Found in the “Acquisition” section of Google Analytics, your channel-specific metrics will segment your traffic based on their point of origin. This is especially useful for a full-scale digital marketing campaign because “total visits” can’t give you an indication of which channels are outperforming the others. The four main channels to keep an eye on are:
- “direct,” which will tell you how many people visited your site directly;
- “referrals,” which include external links from other sites;
- “organic,” which includes visitors who found you after performing a search, and;
- “social,” which includes visitors who found you through social media. It’s an excellent way to gauge the strengths of your SEO, social media marketing, content marketing, and traditional marketing campaigns.

4. Bounce Rate. The bounce rate shows you what percentage of visitors leave your website before further exploring your website. For example, if a potential visitor finds your homepage after searching for you and leaves the page before clicking any other links, they will be considered to have “bounced.” Generally, you want the bounce rate to be as low as possible because the more time someone spends on your site, the more likely they are to convert and perform meaningful action. However, a high bounce rate isn’t necessarily a bad thing, as I outlined in my article, “Bounce Rate: 6 Questions All SEOs Need to Be Able to Answer .”
5. Total Conversions. Total conversions is one of the most important metrics for measuring the profitability of your overall marketing efforts. While it’s possible to define a conversion in many ways (such as filling out a lead form, completing a checkout on an e-commerce site, etc.), conversions are always seen as a quantifiable victory in the eyes of a marketer. You can measure conversions on your site directly, depending on how it’s built, or you can set up a goal in Google Analytics to track your progress. Low conversion numbers could be the result of bad design, poor offerings, or otherwise disinterested visitors.
6. Lead to Close Ratio. This is less a measure of your marketing efforts and more a measure of your sales success, but it’s important to understand in the context of your total return on investment. Without an efficient and successful sales follow-up, any leads you get from marketing could be useless. This metric is easy to define: simply divide your total number of sales by your total number of leads, and you’ll get a ratio that defines your sales success independent of your marketing efforts. If your close rate is low, any drop in revenue or overspending could merely be a symptom of inefficient final sales strategies.
7. Customer Retention Rate. Customer retention can be difficult to measure if your buy cycle is long or if your business revolves around typically one-time-only sales. However, subscription-based services, e-commerce platforms, and most conventional businesses can measure customer retention by calculating what percentage of customers return to your business to buy again. A low customer retention metric can be a symptom of a product or service that isn’t sticky. or an indication of lacking outreach programs. Customer retention is also an important factor for calculating the average value of a customer.
8. Customer Value. Customer value is a difficult metric to calculate. It isn’t going to tell you the health of your sales or marketing efforts, but it is going to be helpful in determining your overall return on investment. It can also be useful in setting your annual company goals. To find your average customer value, you have to take into account all sales the average customer will initiate over the course of your relationship. For startups, calculating this is next to impossible, but you can generate a reasonable estimate based on the number of transactions you can expect per customer per year.
9. Cost Per Lead. Your cost per lead is dependent on the type of strategy you used for each lead generation channel, so it’s a much more specific metric than some of the “big picture” figures we discussed earlier. To calculate your cost per lead, take a look at the average monthly cost of your chosen campaign and compare it to the total number of leads you generated with that specific channel over the same period. For example, if you spent $500 in advertising for a pay-per-click campaign and achieved 10 total conversions over the same period, your cost per lead would be $50. Be sure to incorporate “invisible” costs, such as management time, startup costs, and peripheral expenses.
10. Projected Return on Investment. Your return on investment (ROI) is the single most important factor for any individual marketing campaign because it demonstrates its profitability. A positive ROI means your marketing strategy is effective, while a negative ROI indicates a serious need for adjustment. To calculate the ROI for your campaign, you’ll compare your cost per lead against your lead to close ratio, and compare that figure against your average customer value. For example, if you pay $50 per lead and close 50 percent of your leads, you’ll pay $100 for each successful new customer. If your average customer value is more than $100 in this example, you’ve generated a profit and your marketing campaign can be considered a success.
Regularly checking these metrics will provide you with an accurate pulse of the health of your digital marketing campaign. Over time, you’ll be able to refine your tactics, closely examine which strategies work best and why, and end up with a steady marketing rhythm that can generate more than enough leads to cover your marketing costs and deliver a significant profit. Looking for more insights on marketing your business online? See my eBook, “The Definitive Guide to Marketing Your Business Online .”


