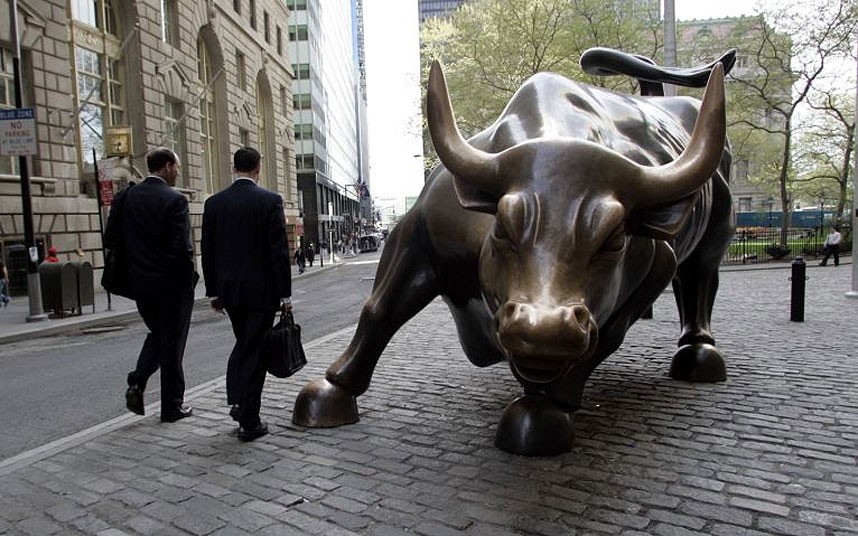
Wheels Within Wheels Identifying Bulls and Bears in Today’s Stock Market
Post on: 16 Март, 2015 No Comment

Traditionally the U.S. stock market has alternated between long periods of growth (secular bull markets) and stagnation (secular bear markets). Within these secular bulls and bears, though, are cyclical periods that can run against the greater trend, wheels within wheels that can cause even seasoned investors to question their long-term forecasts. Februarys Wealth Management Insights examines the movement within todays market environment where we are, where were going and why a market correction may be a sign of good things to come.
What you should know:
1. Although identifying a bull or bear market mid-trend can be difficult, market history can provide insight.
- A common indicator of a shift in the market is the frequency of corrections. In a secular bear market, pullbacks of 10% or more occur every four to five months, versus every 18 months in a secular bull.
- Price/earnings ratios can also indicate where we are in a trend: For example, secular bulls have always started when P/Es were below average. For perspective, P/E ratios most recently bottomed out in 2009.
- The two previous secular bulls have started in environments similar to todays: a banking crisis and deleveraging environment, followed by improved banking fundamentals (such as declining credit losses) and increased household borrowing.
2. The secular bear market that began in 2000 may have run its course.
- After reaching a high point in March of 2000, the S&P 500 saw nearly a 50% correction in 2002 and again in 2009. In February of 2013, the index matched its March 2000 high, marking nearly 13 years of market stagnation.
- That 2009 correction started a bull market, with the S&P 500 increasing 270% over the past four years. What remains to be seen is if the current bull run is cyclical or secular.
- A market correction in 2014 would provide an opportunity to test the market. A muted pullback (market losses of 1020%) may indicate a secular bull, whereas a more severe drop (market losses of more than 25%) may indicate a continuing secular bear.
3. Politics can shape a secular trends intensity and duration.
- Pro-growth policies can spur a new secular bull. For example, an energy policy that encourages the development of natural gas can incentivize greater private investment.
- Continued efforts to address the federal deficit and other structural reforms could keep interest rates low and foster economic development.
- The Feds quantitative easing program obscures the strength of the economy. Continued market stability as QE policies unwind could point toward a period of sustained economic growth.
What you should do now:
Its often recommend that long-term investors try to maintain capital during secular bears and maximize returns during secular bulls. Putting this strategy into practice requires knowing when a shift in the market is short-term or a sign of things to come. Your Baird Financial Advisor has the knowledge and experience to help you distinguish between a temporary trend and a long-term investment opportunity.


