Ultimate Guide To Vanguard REIT ETF (VNQ)
Post on: 13 Август, 2015 No Comment

Real estate has long been a popular asset class as it tends to offer excellent long-term returns with relatively low correlation to equities and can also serve as a viable hedge against inflation. One of the best things about the expansion of the ETF universe is the extent to which it has spawned numerous vehicles for investors to easily and cost-effectively gain exposure to otherwise out-of-reach areas of the market like real estate. As the largest fund in the space, and one that holds a sizable portfolio of U.S.-focused REITs, the Vanguard REIT ETF (VNQ, A+ ) warrants a closer look from anyone looking to add real estate exposure to their portfolio
.In A Nutshell
VNQs formal name is a pretty clear reflection of what this ETF is about – it seeks to replicate the MSCI US REIT Index. The MSCI US REIT Index is a comprehensive index comprised of U.S. equity REITS, as it represents about 85% of the present U.S. REIT universe. Investability is an important consideration with this index, and MSCI uses its “free float” methodology to reflect the availability of shares for U.S. investors [see How To Pick The Right ETF Every Time ].
This behemoth of a fund has accumulated upwards of $14 billion in assets under management since launching in September of 2004.
What Makes VNQ Unique
The sheer size of VNQ is perhaps the most immediately noteworthy characteristic of this fund – at $14 billion in AUM, VNQ is more than three times larger than the next-largest real estate ETF. Despite that size, it is a relatively concentrated fund, as almost half of the funds assets are invested in its ten largest holdings.
Given that the underlying MSCI US REIT index represents so much of the domestic REIT universe, this fund covers a very large portion of the U.S. REIT market, making it a rare “one -stop” option for investors looking to gain exposure to U.S. real estate. VNQ also has solid liquidity, which means that investors can look at this as a viable trading instrument if they so wish [see 5 High-Yielding Real Estate ETFs ].
VNQ is also unique in that, like so many Vanguard funds, its expense ratio is very low; at 0.10%, VNQ offers one of the cheapest REIT ETF investment opportunities in the market.
How It Fits
Most investment advisers believe that real estate should be a core holding in almost all portfolios (due largely to its low correlation with equities and resistance to inflation). While the recent housing market crash was hard on many real estate companies, these periods are relatively rare over the long-haul [see Monthly Dividend ETFdb Portfolio ].
VNQ can deliver impressive returns and those returns do not always line up with bull markets in equities or bonds, meaning that this ETF can offer good diversification within a balanced portfolio.
With its considerable liquidity, VNQ is also a solid option for investors looking for a trading vehicle to access the U.S. real estate market; as such VNQ can fill a role in more elaborate pair trading or options-based strategies.
What Itll Cost You
VNQ is one of the cheapest funds on the market today. With its expense ratio of 0.10%, VNQ is the second-cheapest ETF in the real estate universe, second only to Schwabs U.S. REIT ETF (SCHH ). The expense ratio range for U.S.-focused REIT ETFs reaches from 0.07% to 0.80%, with a category average of 0.42%.
Investors who have accounts at TD Ameritrade or Vanguard can save even more, as this fund is available free of commissions at these two brokerages.
Under the Hood
VNQs portfolio consists of over 100 U.S. REITs, with its top ten holdings making up nearly half of the total assets under management. While that sort of concentration does create some company-specific risk, those top ten holdings are themselves reasonably diverse with respect to the sub-industries they represent, including office, retail, storage, healthcare REITs [see VNQ Holdings ].
While the underlying index that VNQ reflects does use a market cap-weighted approach, there is that aforementioned “free float” adjustment at play in the weightings. Nevertheless, VNQs holdings are weighted heavily towards the largest REITs in the country, which typically means that investors are trading off growth potential for stability.

According to VNQs fact sheet. this ETF allocates roughly a quarter of its total assets each to specialized REITs and retail REITs, with industrial firms accounting for the smallest chunk of exposure.
Yield, Volatility and Performance
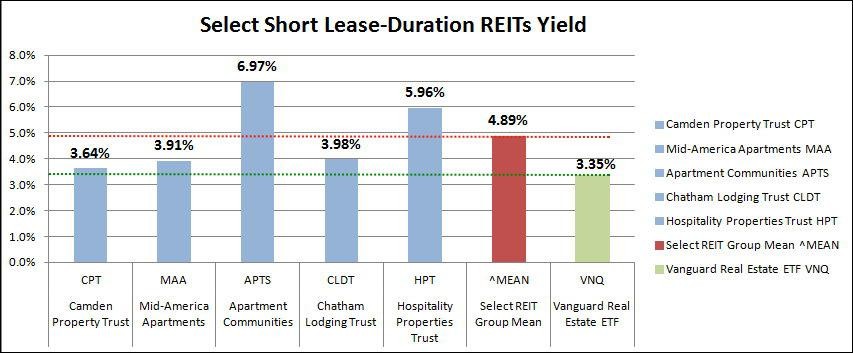
VNQ pays out a quarterly dividend distribution to shareholders, serving as a viable option for investors looking to beef up their portfolios current-income [see VNQ Returns ].
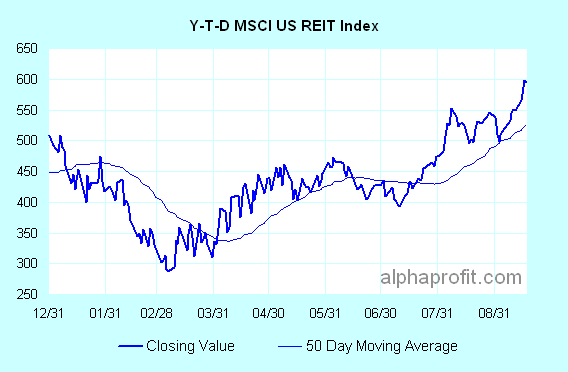
VNQ has logged a good run of performance since its launch in 2004, with only two down years. Since 2008, VNQ has produced the following returns: 2008 (-36.9%), 2009 (+30.1%), 2010 (+28.4%), and 2011 (+8.6%). By comparison, the S&P 500 ETF (SPY ) has returned the following: 2008 (-36.8%), 2009 (+26.4%), 2010 (+15.1%), and 2011 (+1.9%).
Other Options
Within the broader domestic and international REIT categories, investors have more than two dozen other ETF choices. While some offer broadly similar exposures as VNQ, others employ notably different strategies.
- Charles Schwab U.S. REIT ETF (SCHH, A ): This is the cheapest fund available, with an expense ratio of 0.07% (and commission-free trading for Schwab customers). Although this funds allocations are broadly similar to VNQ, it holds fewer positions and is somewhat more concentrated in its top holdings.
- PowerShares Active U.S. Real Estate Fund (PSR, C+ ): This is an actively-managed alternative to the market cap-weighted products that dominate the category, but the expense ratio is quite high at 0.8%.
- iShares FTSE EPRA/NAREIT Global Real Estate Ex-U.S. Index Fund (IFGL, A ): This is the second-largest global real estate ETF and, as the name suggests, it offers exposure to non-U.S. real estate companies.
- IndexIQs US Real Estate Small Cap ETF (ROOF, B+ ): This fund offers investors exposure to smaller real estate companies. However, the expense ratio here is on the high end of the range (0.69%) and the fund is relatively illiquid.
[For more ETF analysis, make sure to sign up for our free ETF newsletter or try a free seven day trial to ETFdb Pro ]
Disclosure: No positions at time of writing.


