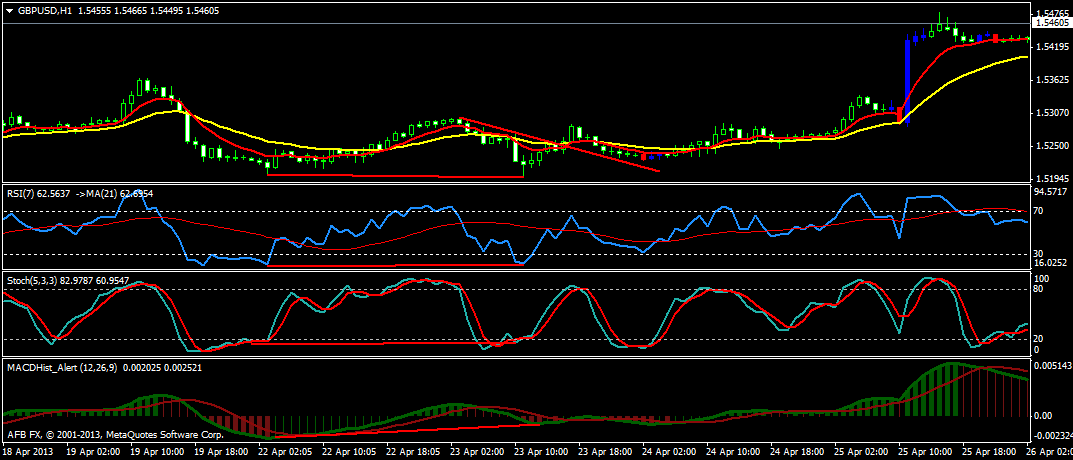
Trading Divergences On H1 H4 And D1 Timeframes!
Post on: 16 Март, 2015 No Comment

June 17 2012
Divergences on H1, H4 and D1 timeframes can be pretty strong trend reversal as well as trend continuation signals. When you are trading, you need a leading indicator. There are not many leading indicators. Most indicators are lagging. Trading with moving averages will always give you a buy/sell signal when the price action has almost completed the move. The same goes for almost all other indicators as most of them are based on moving averages. As a technical trader, you need to learn how to predict the trend reversal well in time if you want to capitalize on it. One of the popular leading indicators is the Divergence. When you combine a divergence pattern with a trendline and the candlestick reversal patterns, you get a very powerful combination.
So lets discuss Divergences today! Divergence patterns are observed using oscillators like the MACD, Stochastic, RSI and the other oscillators. However, these three oscillators namely the MACD, Stochastic and the RSI are the most popular when it comes to divergence trading. Oscillators are those indicators that oscillate between two values. Divergence can be of two types:
1. Regular Divergence
2. Hidden Divergence
Regular Divergence. A divergence pattern is formed when the price action makes a lower low while the indicator makes a higher low or the price action makes a higher high and the indicator makes a lower high. This type of divergence is known as a Regular Divergence. When the price action makes a lower low and the oscillator like the MACD, Stochastic or the RSI makes a higher low, the pattern formed is known as the Regular Bullish Divergence. It means the downtrend is going to end soon and the uptrend will start. When you see a candlestick reversal pattern just after the appearance of the Regular Bullish Divergence, it is time to immediately enter into a long trade. Watch this video below that explains this concept more clearly:
In the same manner, when the price action is making a higher high while the oscillator is making a lower high, this is known as Regular Bearish Divergence. When you spot Regular Bearish Divergence and a candlestick reversal pattern just after that pattern, it is a pretty strong trend reversal signal. Watch Part II of the above video below:
Hidden Divergence. Unlike the regular divergence which is a trend reversal signal, a hidden divergence is a trend continuation signal. When the price action makes a higher low while the oscillator makes a higher high, it is known as Hidden Bullish Divergence meaning the Uptrend will resume soon and the downtrend is just a short retracement. In the same manner, when the price action makes a lower high while the oscillator makes a higher high, it is known as the Hidden Bearish Divergence meaning the downtrend will continue. Watch Part III of the above video that explains divergence in a very good manner:

Trading these Divergence Patterns can be very profitable if you combine them with candlestick reversal patterns and trendline breaks. However, you must be very clear about the Regular and the Hidden Divergence before you start trading these patterns. There are times when you can confuse a regular pattern with the hidden pattern so first practice identifying these patterns on the demo account before you start using them in live trading.
You can read more about How to trade with Divergence Patterns . As said above, dont make the mistake of confusing regular divergence with the hidden divergence when identifying them on the charts. This might require some practice on your part but it will pay off in the long run when you will be able to make a lot of pips using these leading indicators in your trading. Now when you see a regular divergence pattern appearing on the H1 timeframe while you see a hidden divergence pattern appearing either on the H4 or the D1 timeframe, you can pretty much assume that there will be a short retracement before the market will continue in the direction of the trend.
One the other hand when you see a regular divergence pattern appearing on the H1 timeframe and a regular divergence pattern appearing on either H4 or D1 timeframe, it means that the trend is about to reverse in a big way. So mastering how to trade with Divergence Patterns can be a very powerful tool in your technical analysis toolkit.
Ultimate Swing Trading
Get The Insider Secrets Of Successful Traders Report That Has Been Downloaded 37,000+ Times FREE!


